
A mild pick up in the UK’s month-on-month exporter counts and revenues in March 2022 masks a more worrying picture of the impact of Brexit on exporters over the past 12 months. Exporter counts and revenues have gone up by 2.33% and 2.99% respectively
across all UK regions in March 2022 compared to February 2022.
However, using a 12-month moving average, the numbers of exporters has dropped by 0.6%, their revenues by 0.7% and their employment by 1.3%. These trends come on the back of declines in February and projected declines in May and June after a small projected increase in April.
Yorkshire and Humberside difficulties
At a regional level, Yorkshire and Humberside has fared the worst over the past 12 months, with the largest 12-month moving average decline in revenues of any region. Exporter revenues dropped by nearly 3% and exporter counts by 2.5% while employment dropped by 0.9%, matched only by the South East.
Yorkshire and Humberside have also had the worst drop in both employment and revenues of any region comparing Q1 2022 with Q1 2021. In Q1 2022, exporter revenues fell by nearly 10% and employment by 13.5% compared to a year earlier.
Large companies in the region were particularly severely hit by a 17.5% drop in revenues.
This pattern seems to be replicated in the month-on-month change since February, with the region again suffering a drop in revenues and employment, even though the numbers of exporting companies rose marginally.
Wales fares best
Wales appears to be faring the best since Brexit. Although employment and revenues have declined over the past 12 months the numbers of exporting companies have increased.
Its drop in employment over the last quarter has been the lowest of any region at just over 2% and Wales, alongside Northern Ireland, have been the two nations over the last quarter where revenues have also dropped the least (-3.7% and -1.9% respectively).
The reasons for this may lie in the sectoral balance of exports across the UK nations. For example, arts and entertainment exporters in Northern Ireland have done well, perhaps reflecting its popularity as a filming location, as have real estate exporters, reflecting a general buoyancy in the real estate market.
Covid and Brexit recovery
At a broader sector level, there is evidence of both recovery from the Covid pandemic and Brexit supply chain shortage effects. For example, over the last 12 months, revenues and employment accommodation and arts and entertainment have grown although the number of exporters has fallen back. In other words, these businesses have not re-recruited staff but have used the pandemic as a way of becoming more efficient. This is similarly the case for agriculture and public administration and defence.
Construction, energy supplies and professional services exporters have fewer employees and lower revenues, while there are fewer financial services exporters and they employ fewer people, but revenues are higher.
The growth in exporter revenues over the past month (February 2022 to March 2022) in public administration and defence arguably reflects the immediate impact on exporters in these sectors from Russia-Ukraine crisis.
As a result of the new and updated sanctions, Coriolis Technologies and the Institute of Export & International Trade have developed an online sanctions tool to support exporters and ensure they do not fall foul of new regulation. The tool can be used online free of charge here.
Coriolis Technologies chief executive Dr Rebecca Harding said:
“Since 2020 there has been a general drop in exporter activity and so seeing the expected post-Covid rebound fall flat offers little hope for growth as global geopolitical risk heightens. Our data has been indicating a decline in exports and exporters since last year, and our forecast is for further downside risk because of sanctions and uncertainty in the wake of the Russia-Ukraine crisis.”
Institute of Export & International Trade director general, Marco Forgione, said:
“These detailed quarterly figures will make concerning reading for anyone interested in promoting UK exports. Brexit is clearly playing a role in inhibiting exporters from selling their goods and services as widely as they once did, but other factors such as the global supply chain crisis and the ongoing war in Ukraine also play their part.
"The mechanisms as to how that is happening are quite complex and seem to be spread across a range of different of sectors and regions.
“We have to make exporting easier for companies and encourage them to train their people – that’s why last month the IOE&IT made £1 million of training freely available. Take up has been really encouraging with all the funding being allocated in less than a week, demonstrating that traders want to do more – these figures show us how big the task is.”
The findings in detail
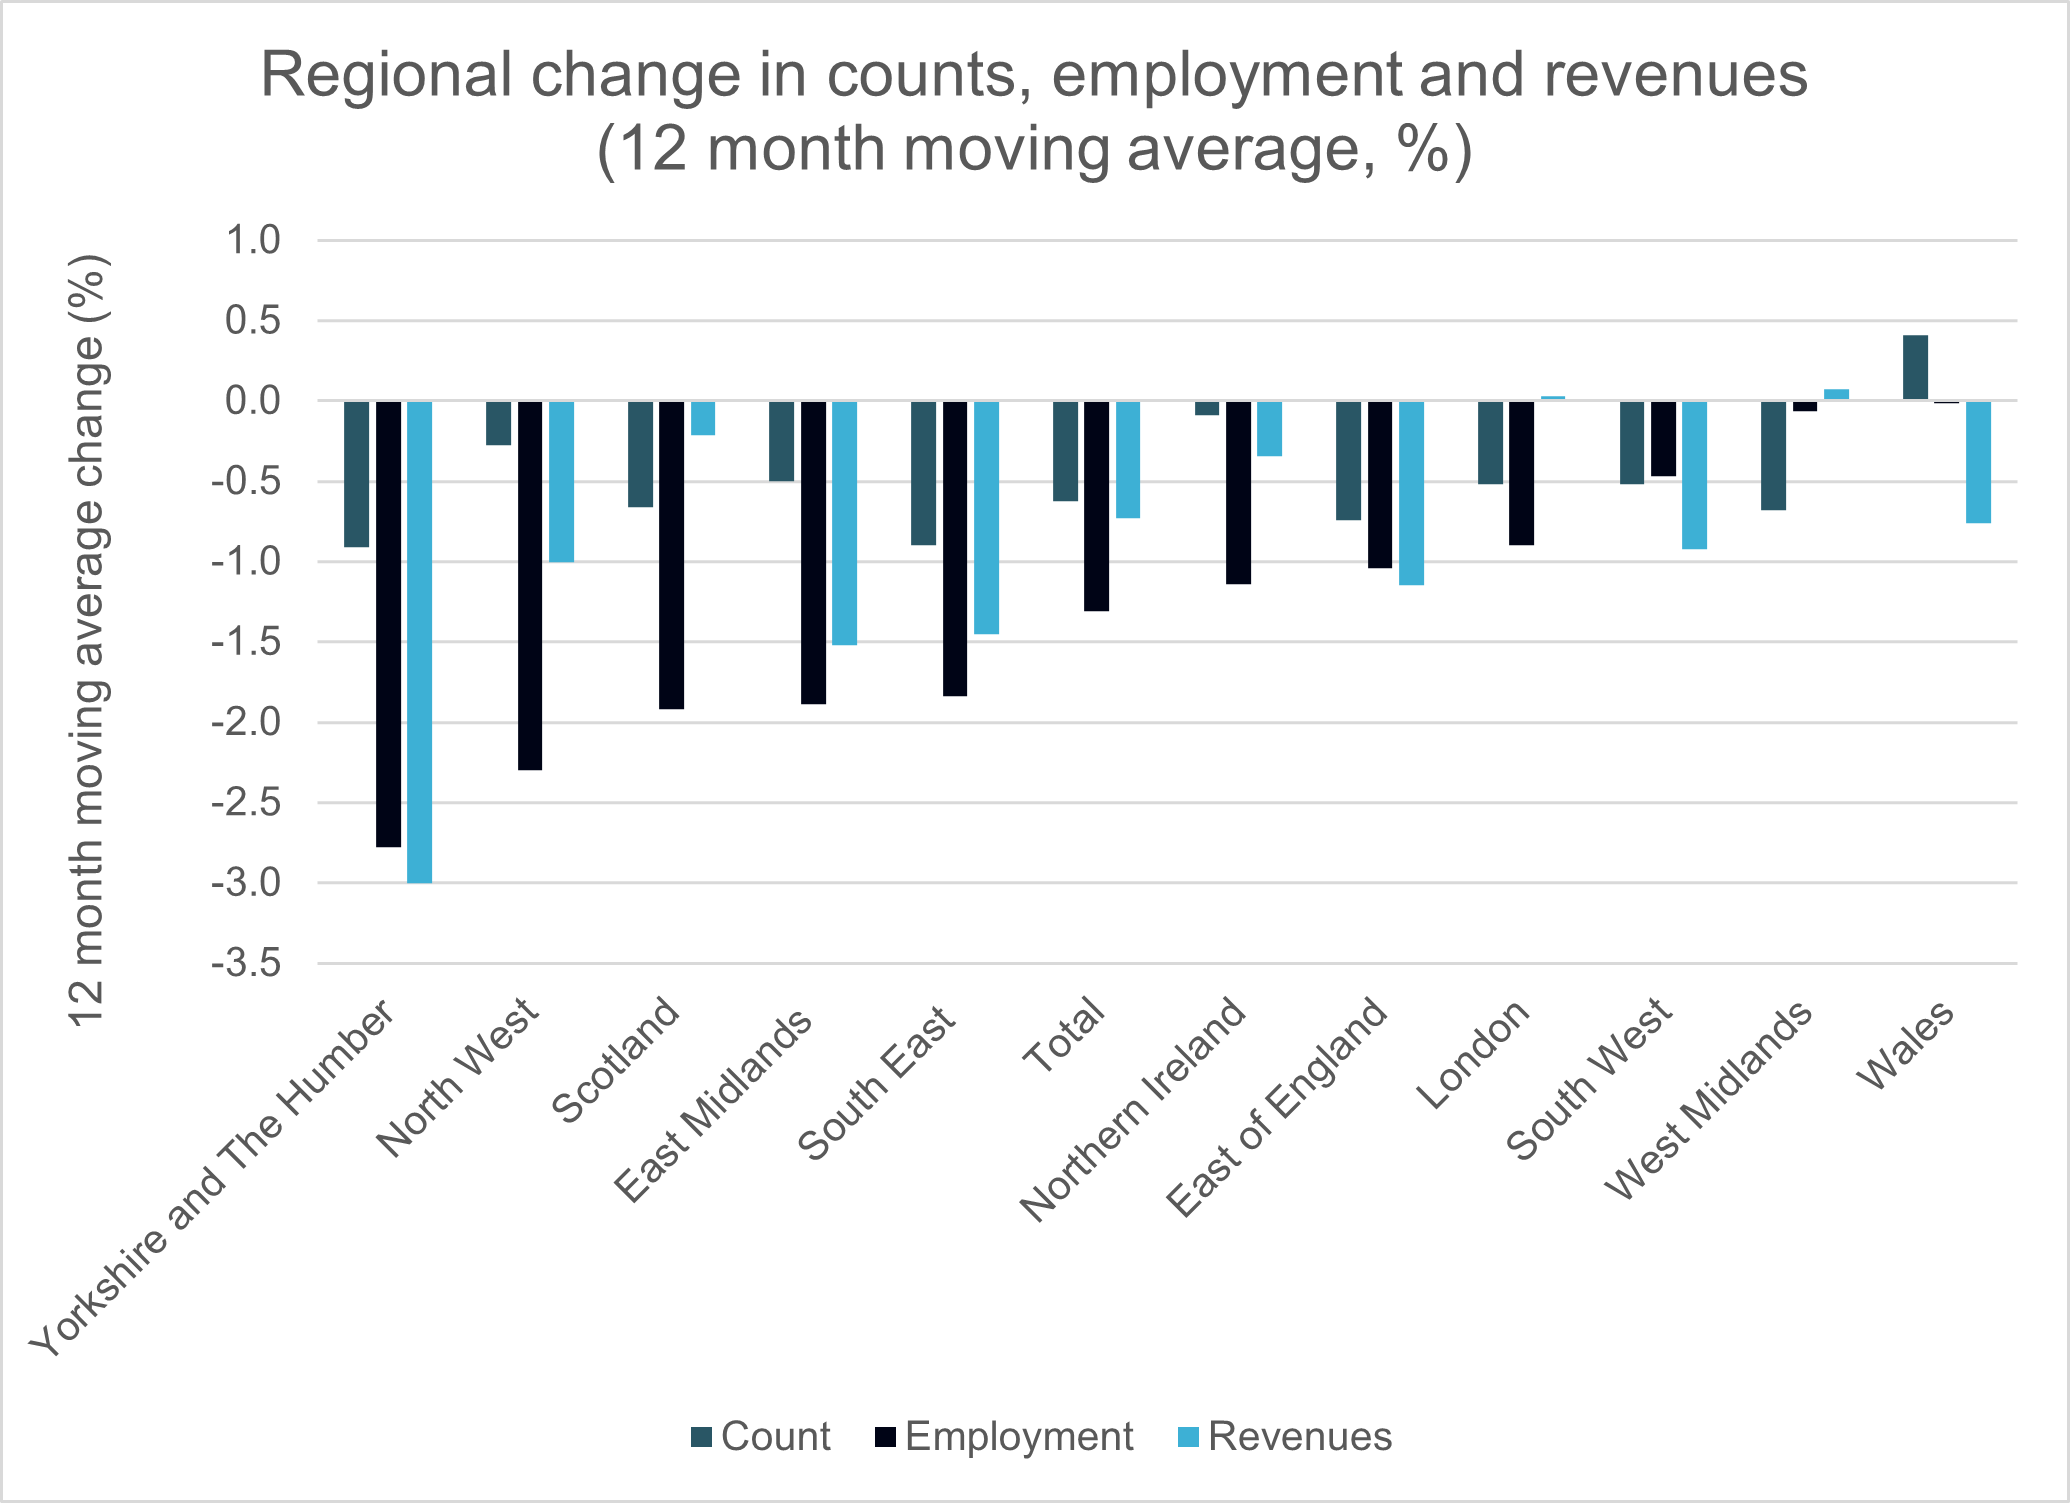
Figure 1: 12-month moving average changes in exporter counts, employment and revenues by region
Note: A 12-month moving average change for March (ie takes an average of growth for the last 12 months and compares it to the previous month’s average over the past 12 months).
UK regions
For UK regions, the 12-month moving average percentage change shows a drop of 0.6% for counts, a drop of 1.3% for employment, and a drop of 0.7% for revenues. Wales is the only region to show an increase of counts at 0.4% growth, whilst no region showed an increase in employment, and only the West Midlands showed growth in revenues at 0.1%.
Yorkshire and the Humber and the South East declined most markedly in terms of counts at 0.9%, whilst Yorkshire and the Humber also declined most significantly in employment and revenues, at -2.8% and -3% respectively.
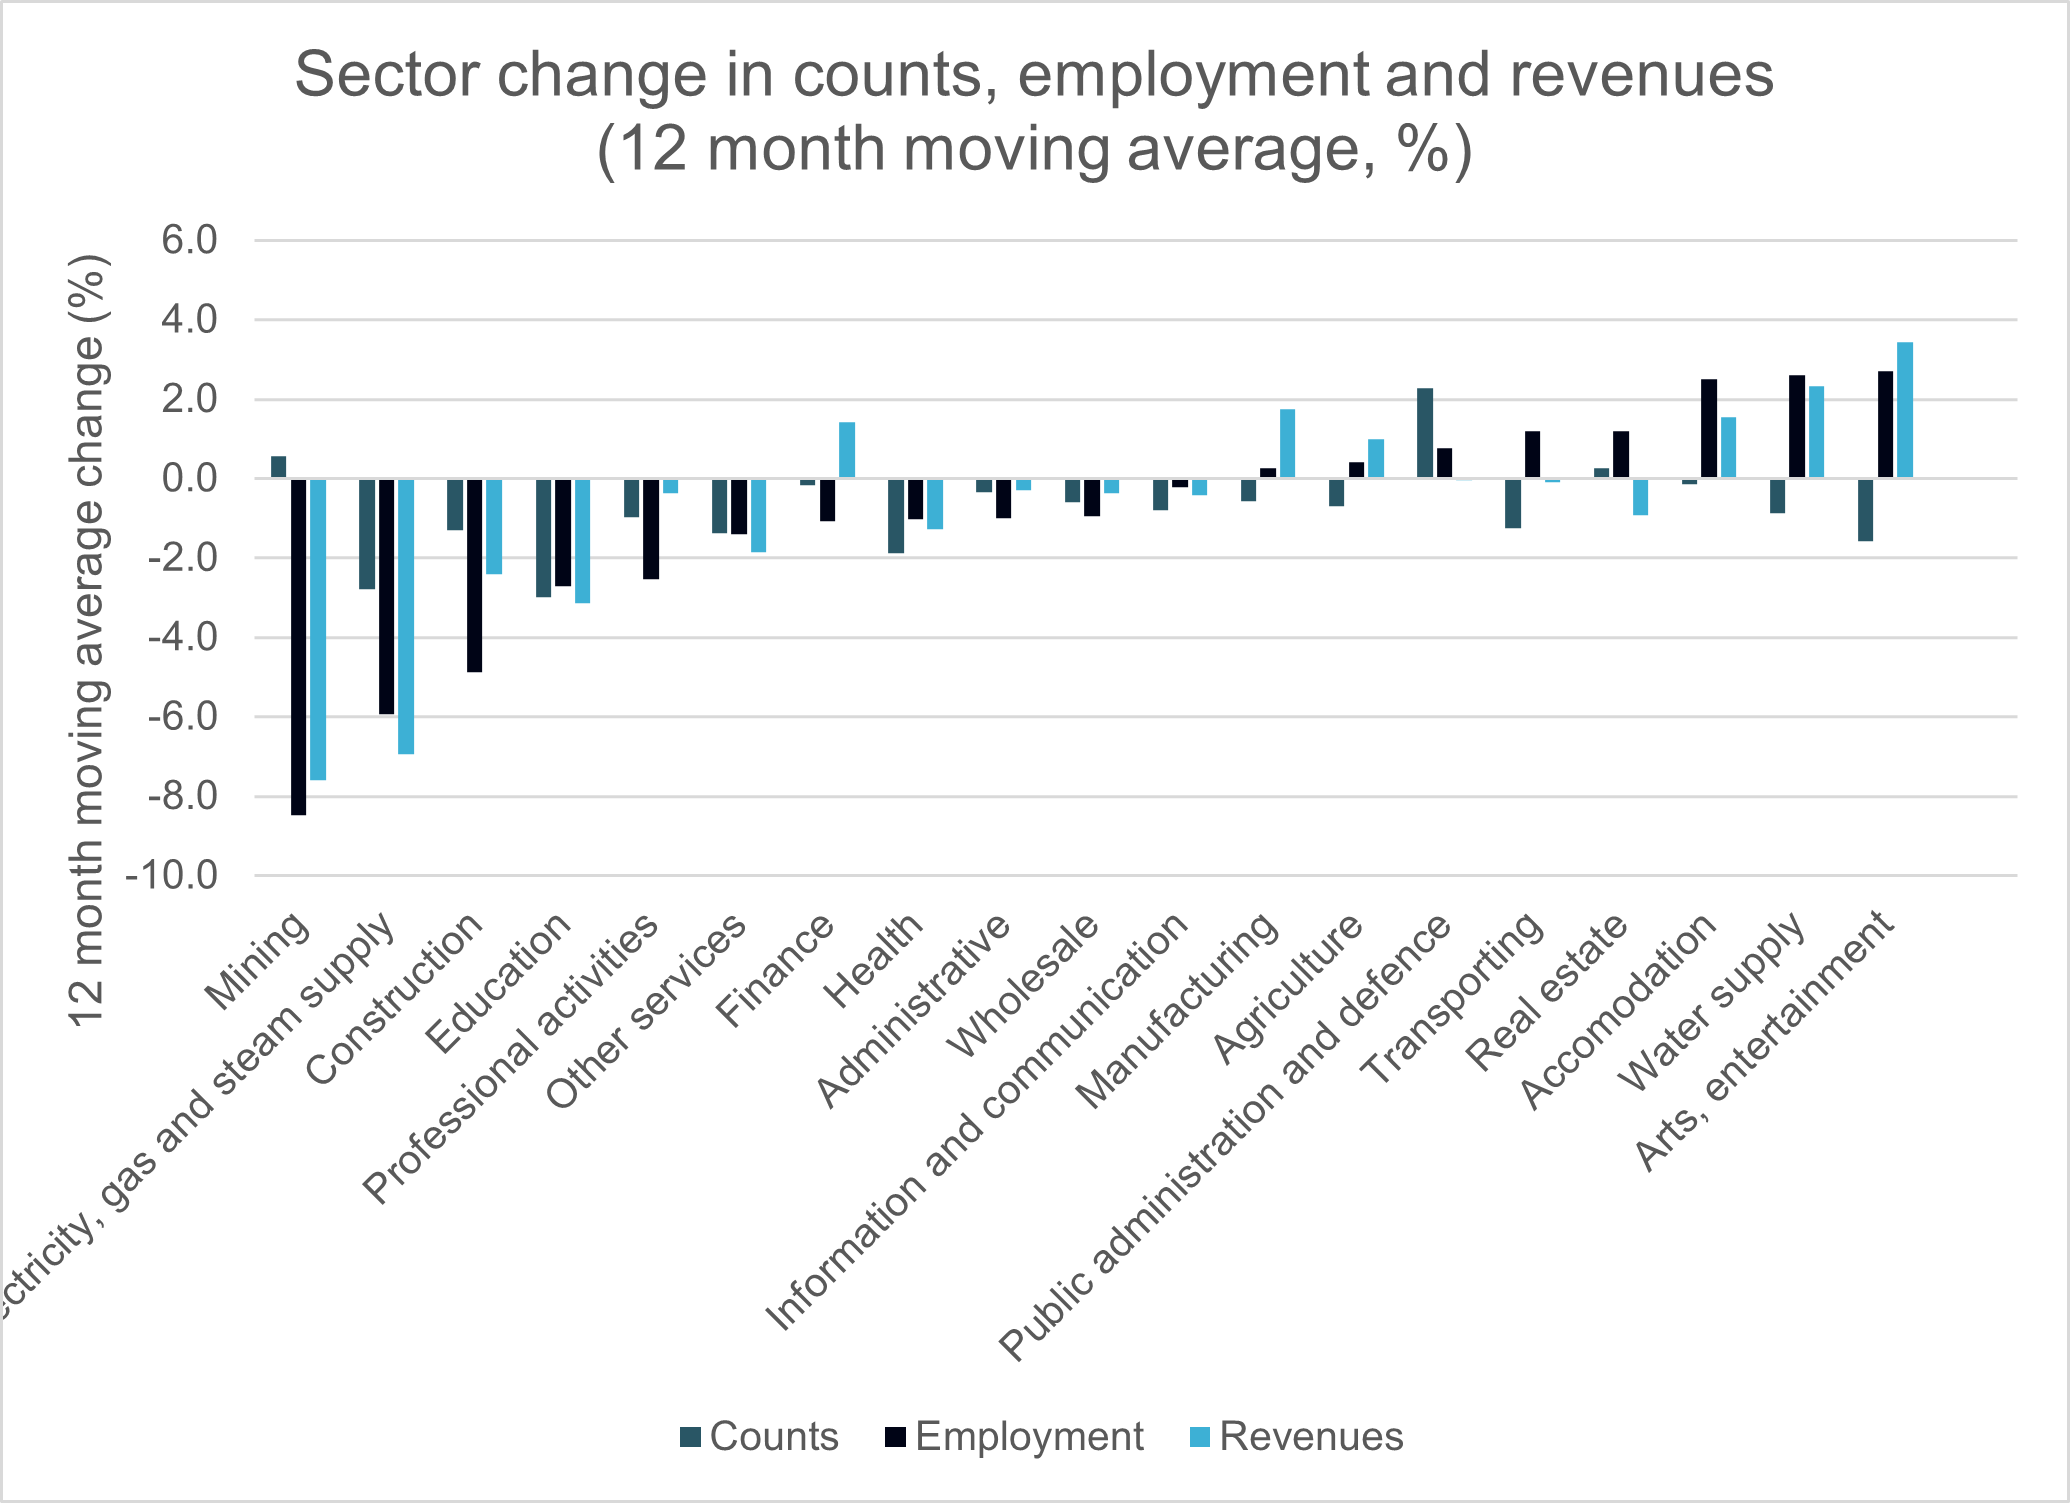
Figure 2: 12 month moving average changes in exporter counts, employment and revenues by sectors
Note: A 12-month moving average change for March (ie takes an average of growth for the last 12 months and compares it to the previous month’s average over the past 12 months).
By sector
At the sector level, the 12-month moving average percentage change illustrates that Mining, Electricity, Gas and Steam Supply, Construction, and Education were among the most damaged, whilst Arts, Entertainment, Water Supply and Accommodation were amongst the biggest winners.
The largest increase in counts was seen by Public Administration and Defence at 2.3%, whilst the largest decrease was seen in Education, at -3%. The largest increase in employment is observed in Arts, Entertainment at 2.7%, whilst the largest decline was in Mining at -8.5%.
The largest increase in revenues was seen in Arts, Entertainment at 3.4% and the largest declined is observed in Mining at -7.6%.
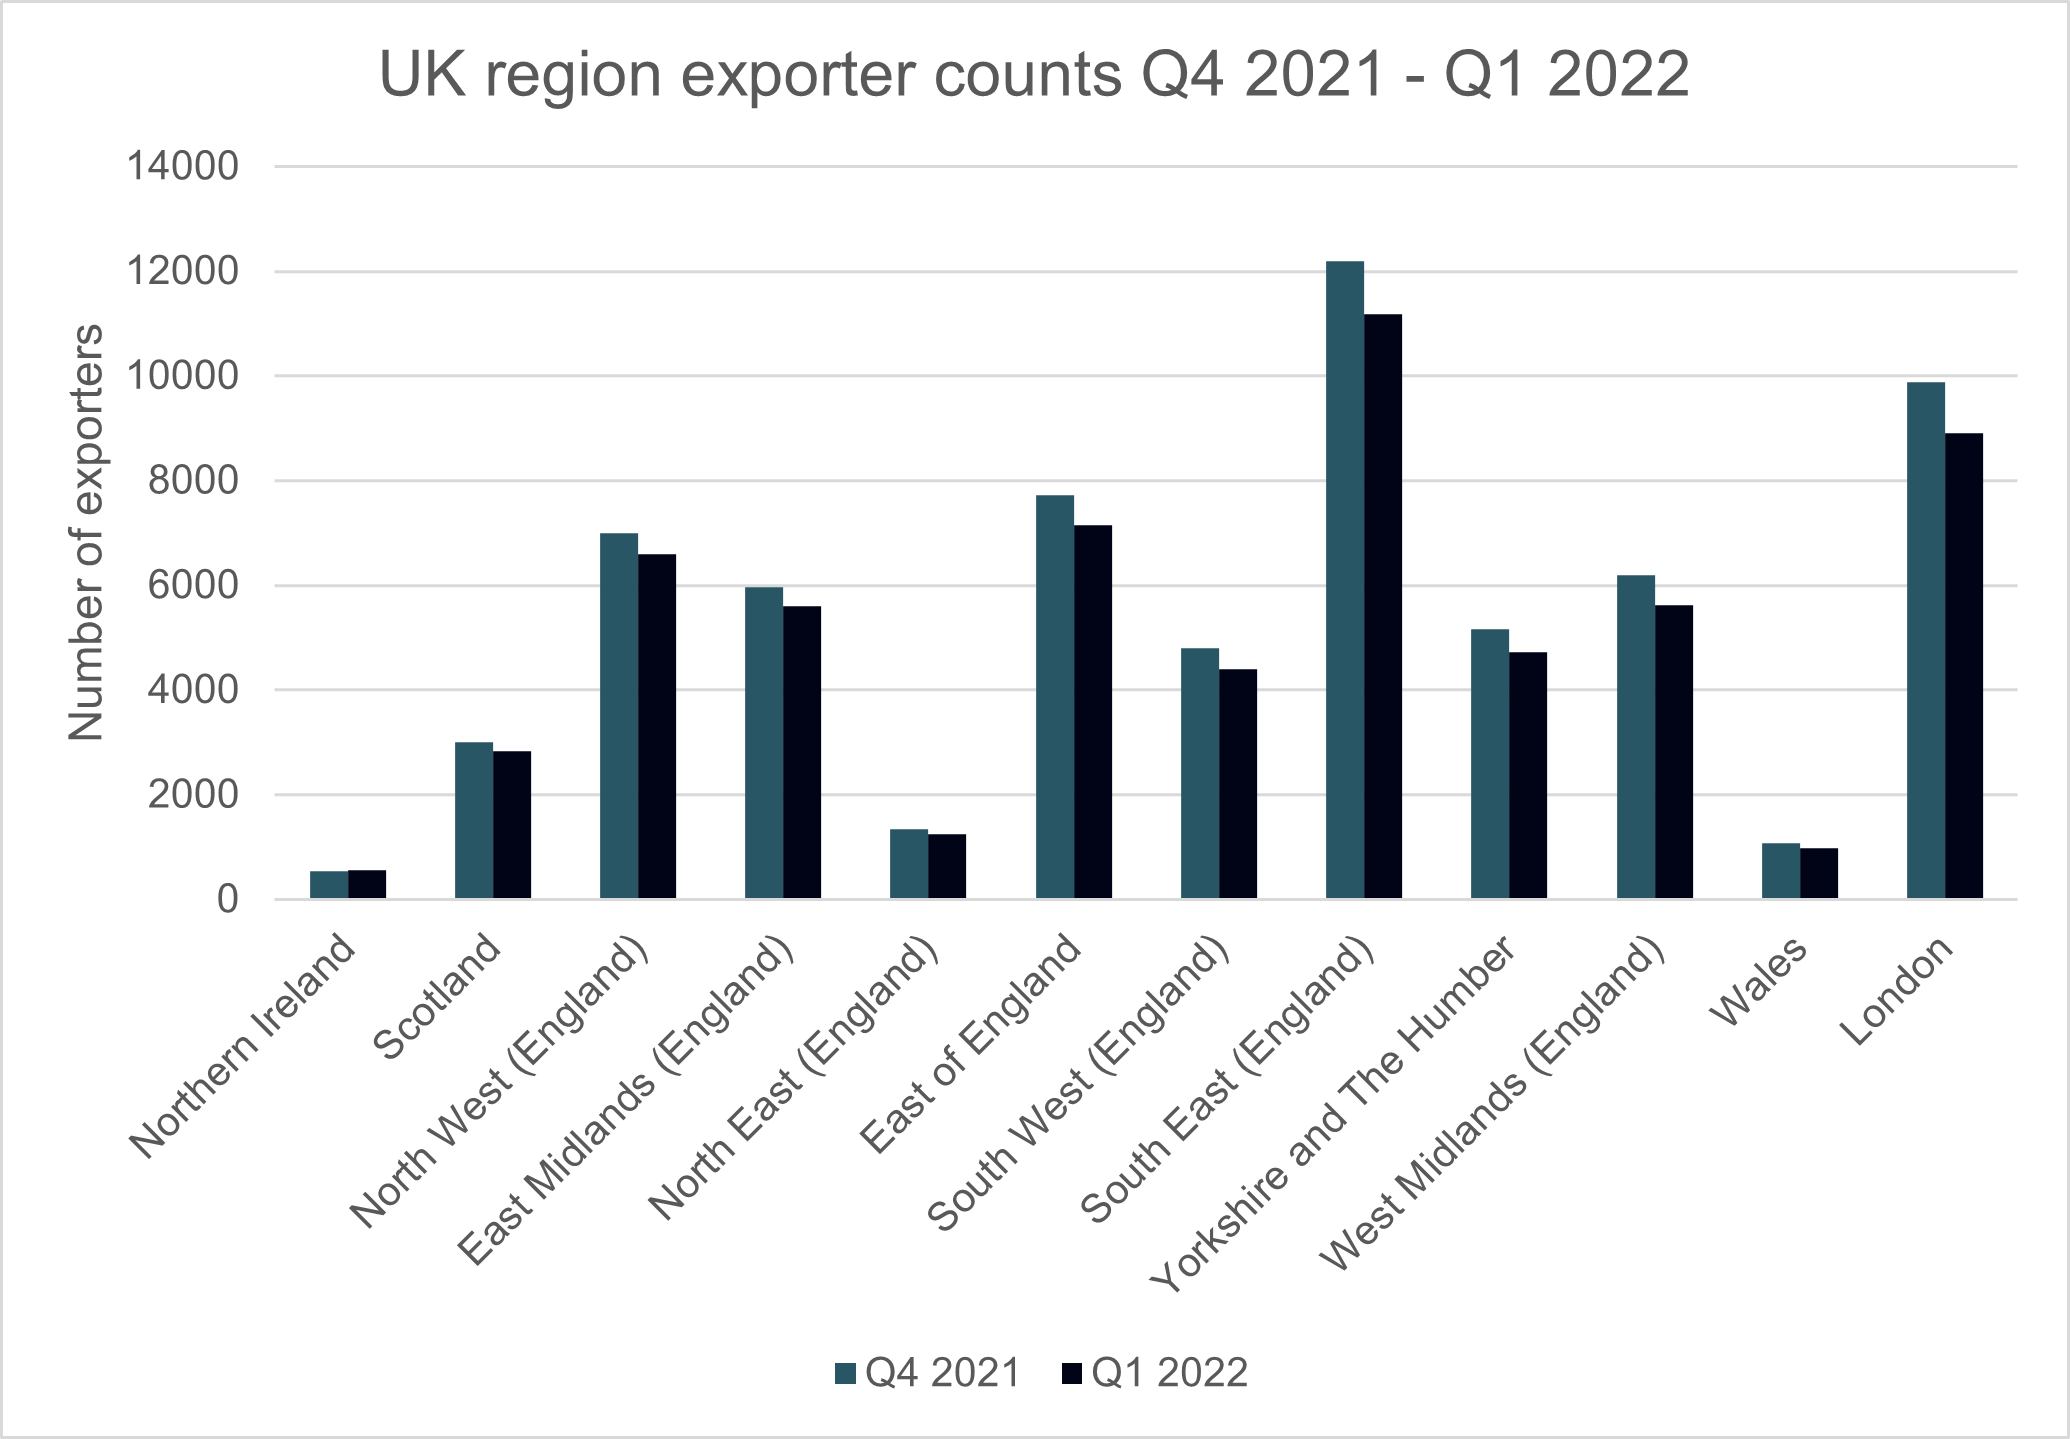
Figure 3: Quarter on quarter regional exporter counts
Quarter-on-quarter changes by region
Quarter on quarter, UK regions showed a decline in exporter counts of 7.82%. The largest percentage declines are seen in London at -9.78%, Wales at -9.34% and the West Midlands at -9.32%. Only Northern Ireland showed positive growth, at 2.25% - far outpacing the second-best performing region, Scotland, at -5.72%.
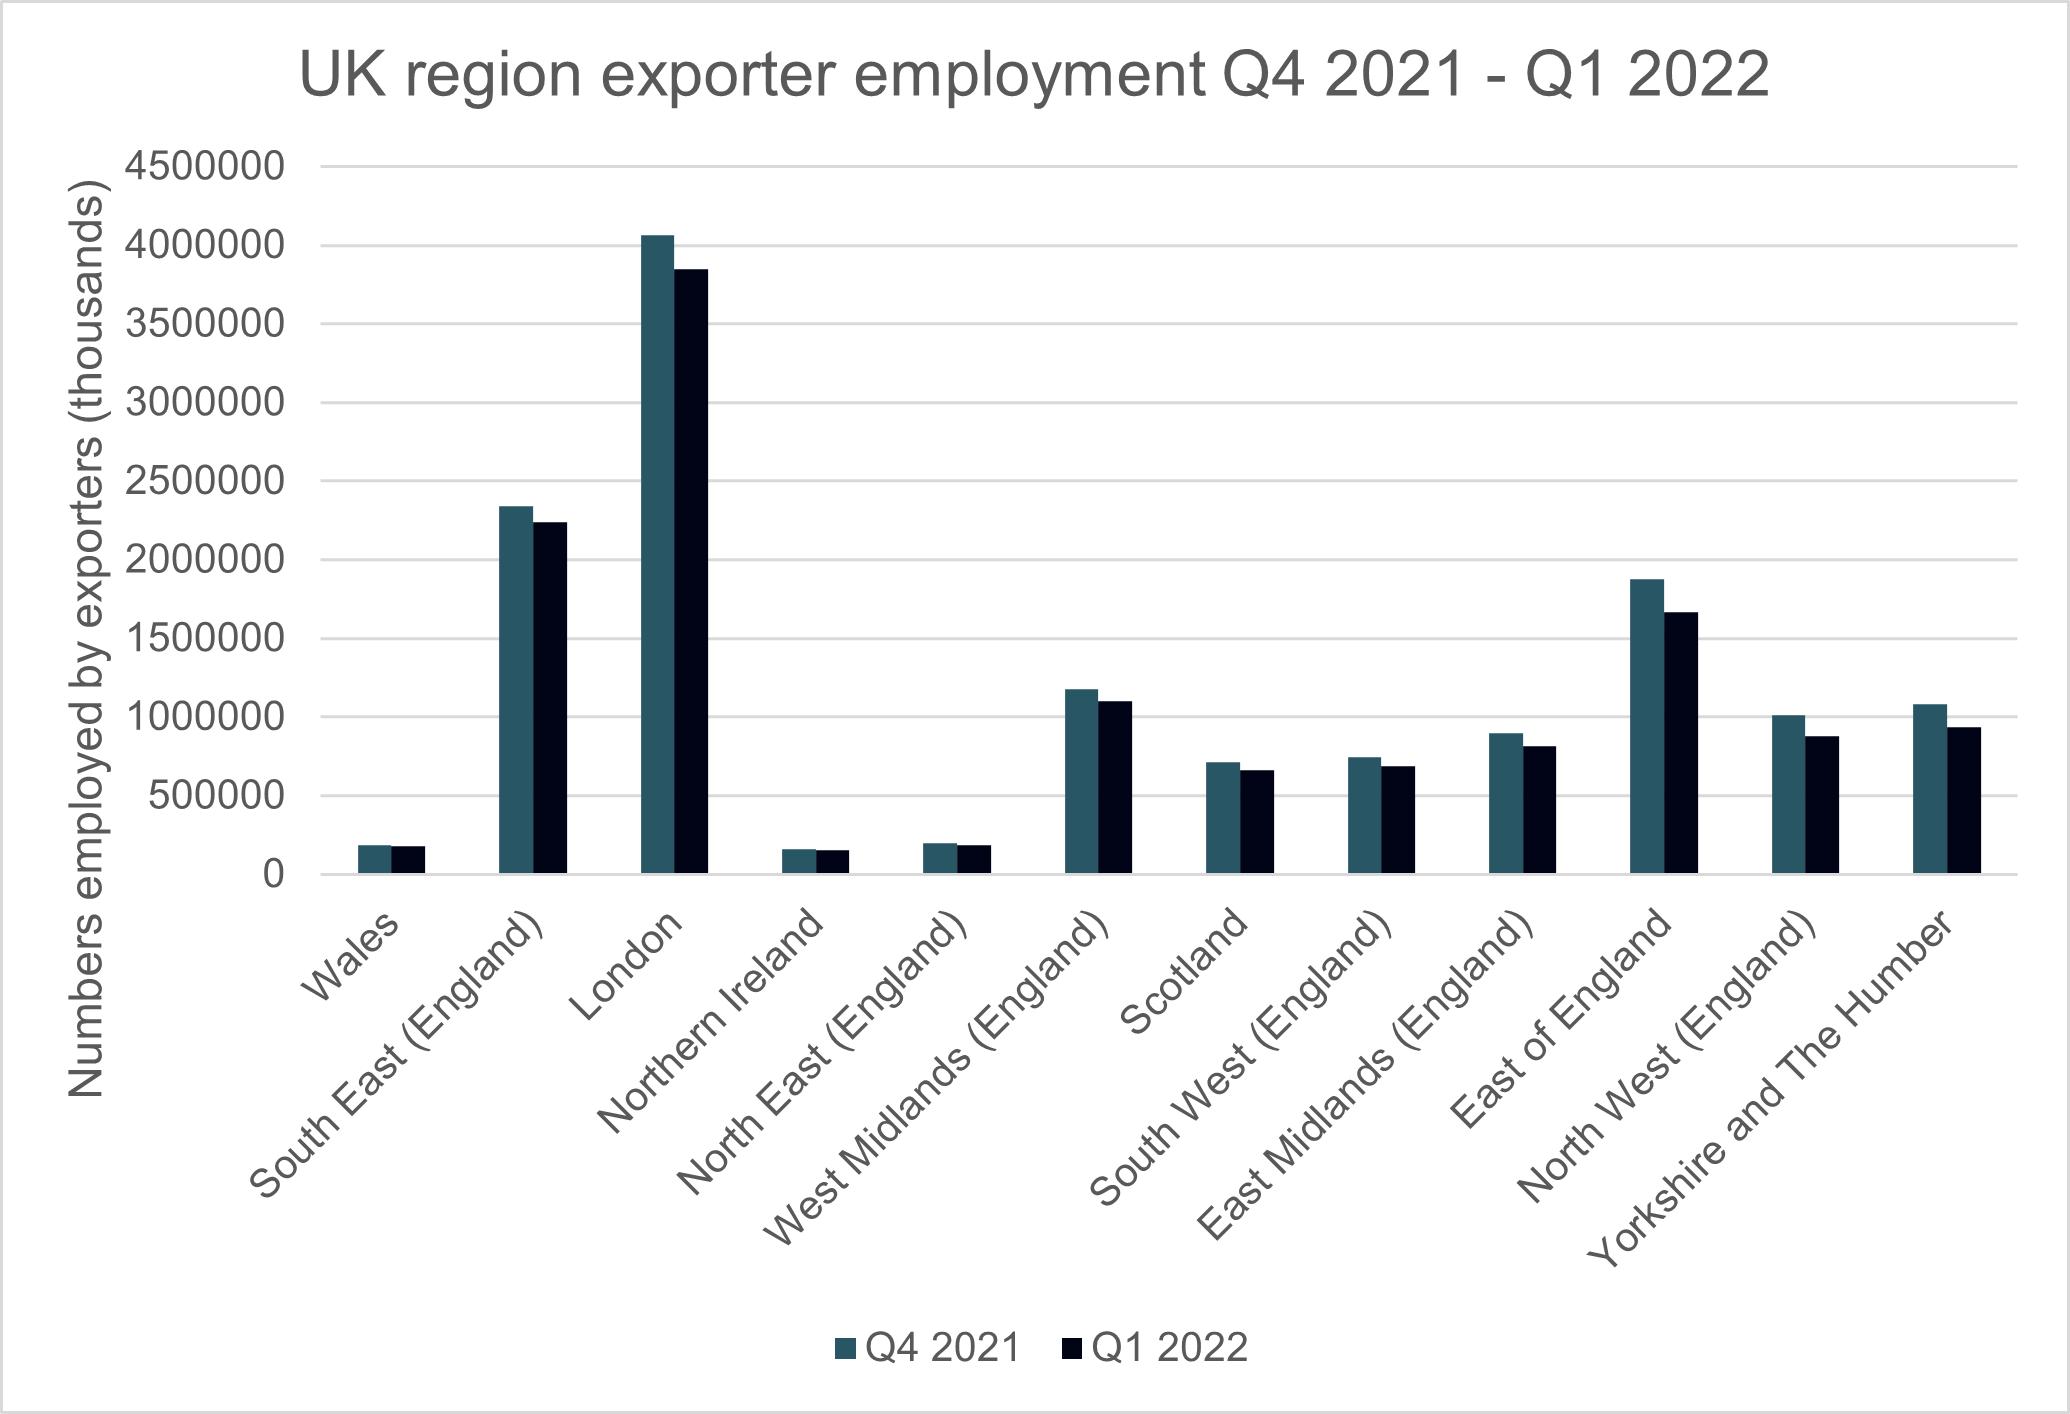
Figure 4: Quarter-on-quarter regional exporter employment
Quarter on quarter employment declined by 7.68% overall, with no region seeing growth. The best performers here were Wales at -2.37%, South East at -4.46% and London at -5.2%, whilst the worst performers were Yorkshire and The Humber at -13.52%, North West at -13.22% and East of England at -11.09%.
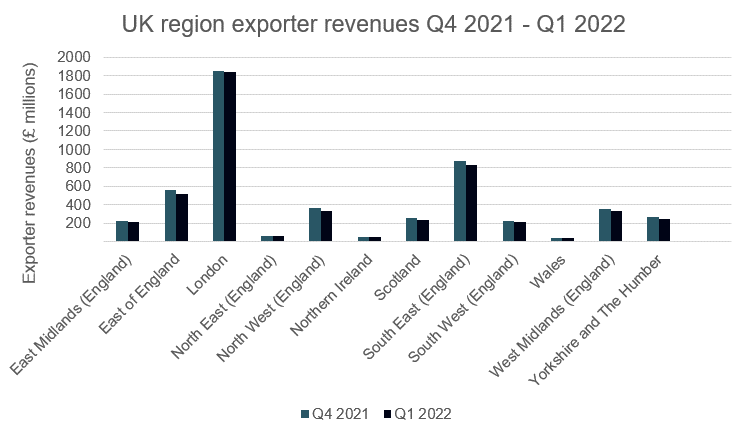
Figure 5: Quarter-on-quarter regional exporter revenues
Quarter-on-quarter revenues overall also showed a decline, but this was less severe than in counts or employment – at -4.48%. Similar to employment, no region saw growth this quarter. The best performers were London at -0.86%, Northern Ireland at -1.92%, and Wales at -3.72%.
The worst performers were Yorkshire and The Humber at -9.92%, North West at -8.79%, and East of England at -7.79%.
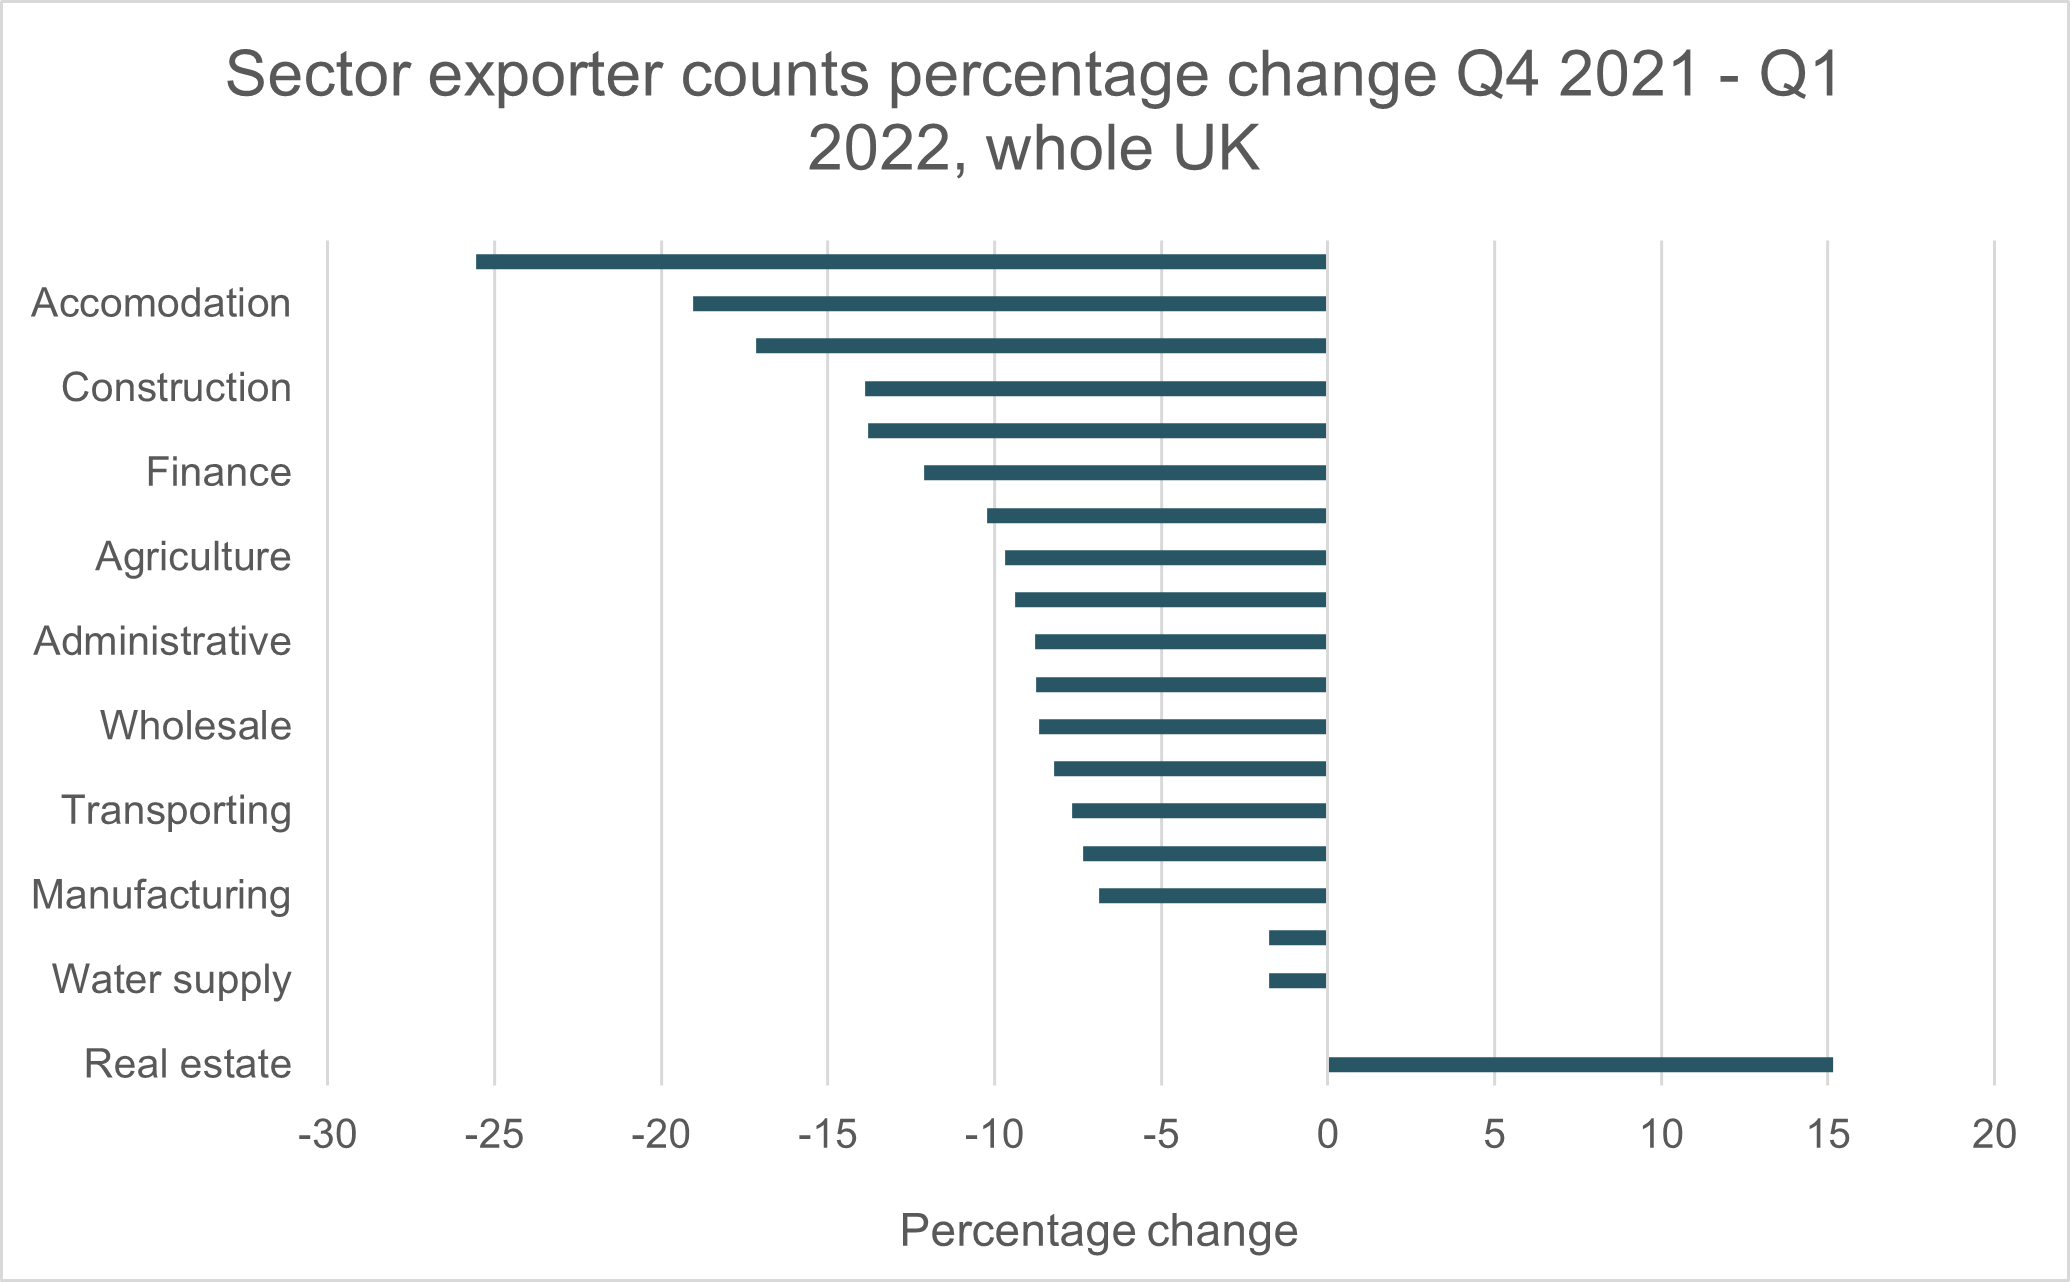
Figure 6: Quarter on quarter sector exporter counts
Quarter-on-quarter changes by sector
In Q1 of 2022, Real Estate was clearly the biggest winner in terms of the number of exporters per sector – growing by 15.14%. However, this large growth margin is partially due to the small sector size of only 180 exporters in Q1 2022. No other sector showed growth in counts in this period. The worst performing sectors were Arts, Entertainment at -25.56%, Accommodation at -19.03% and Construction at -13.89%. Sectors such as Public Administration and Defence performed poorly, but again, the percentage change appears artificially inflated due to the small number of exporters.
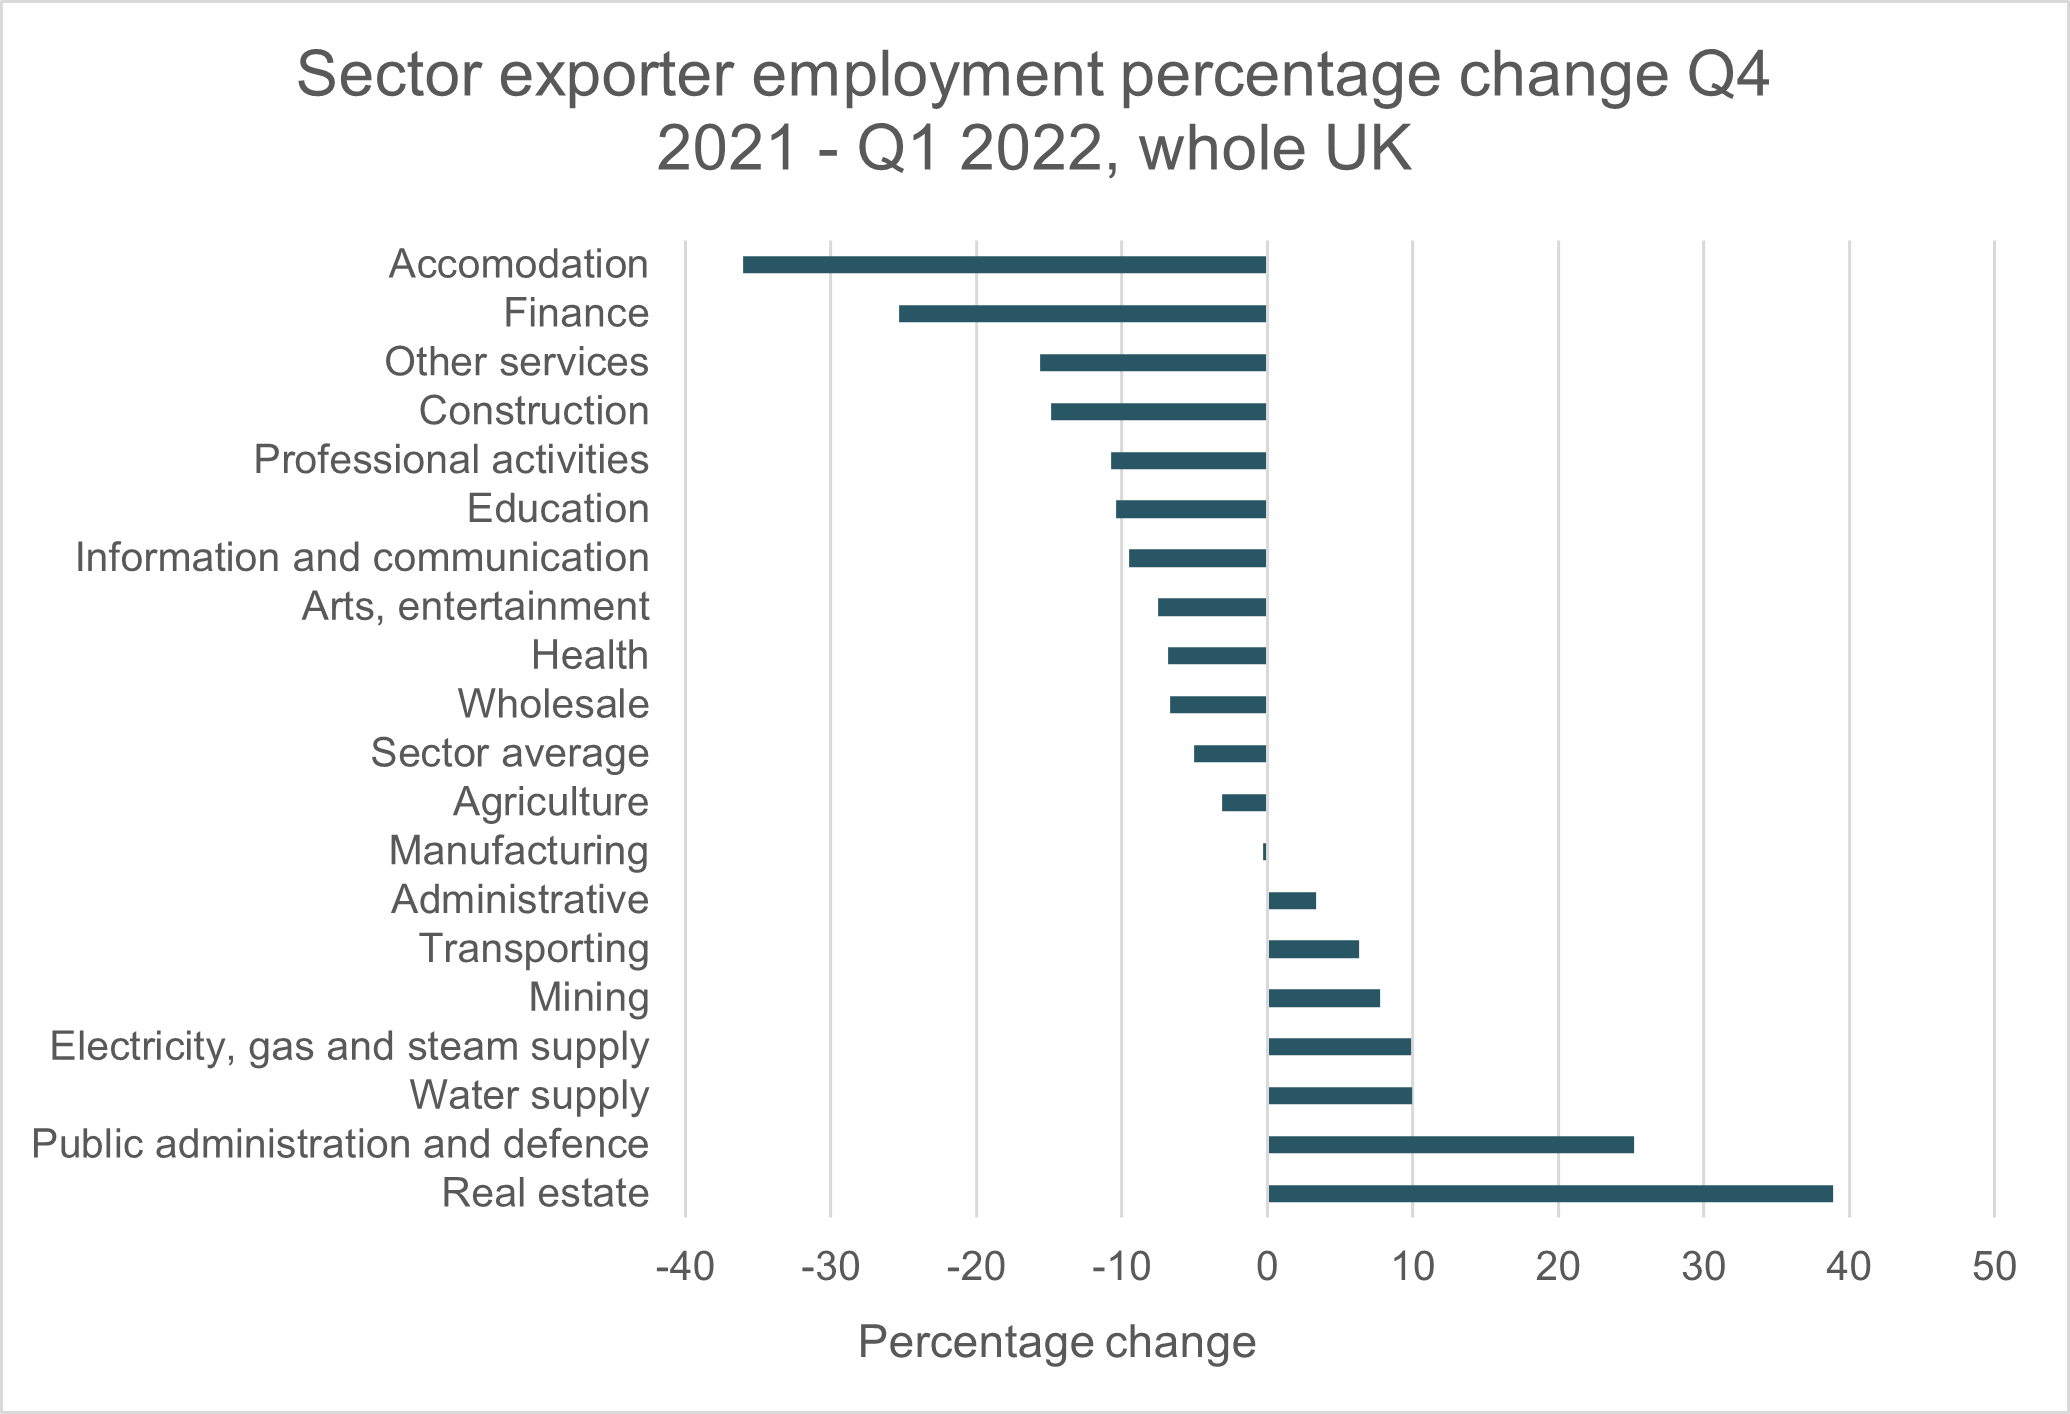
Figure 7: Quarter-on-quarter sector exporter employment
Exporter employment
Sector exporter employment declined at 5.01% overall in Q1 2022. Again, the largest winner was Real Estate with a 38.87% growth, followed by Public Administration and Defence at 25.22%, and Water Supply at 9.95% growth. Amongst the largest losers were Accommodation at -36.03%, Finance at -25.30%, and Construction at -14.89%.
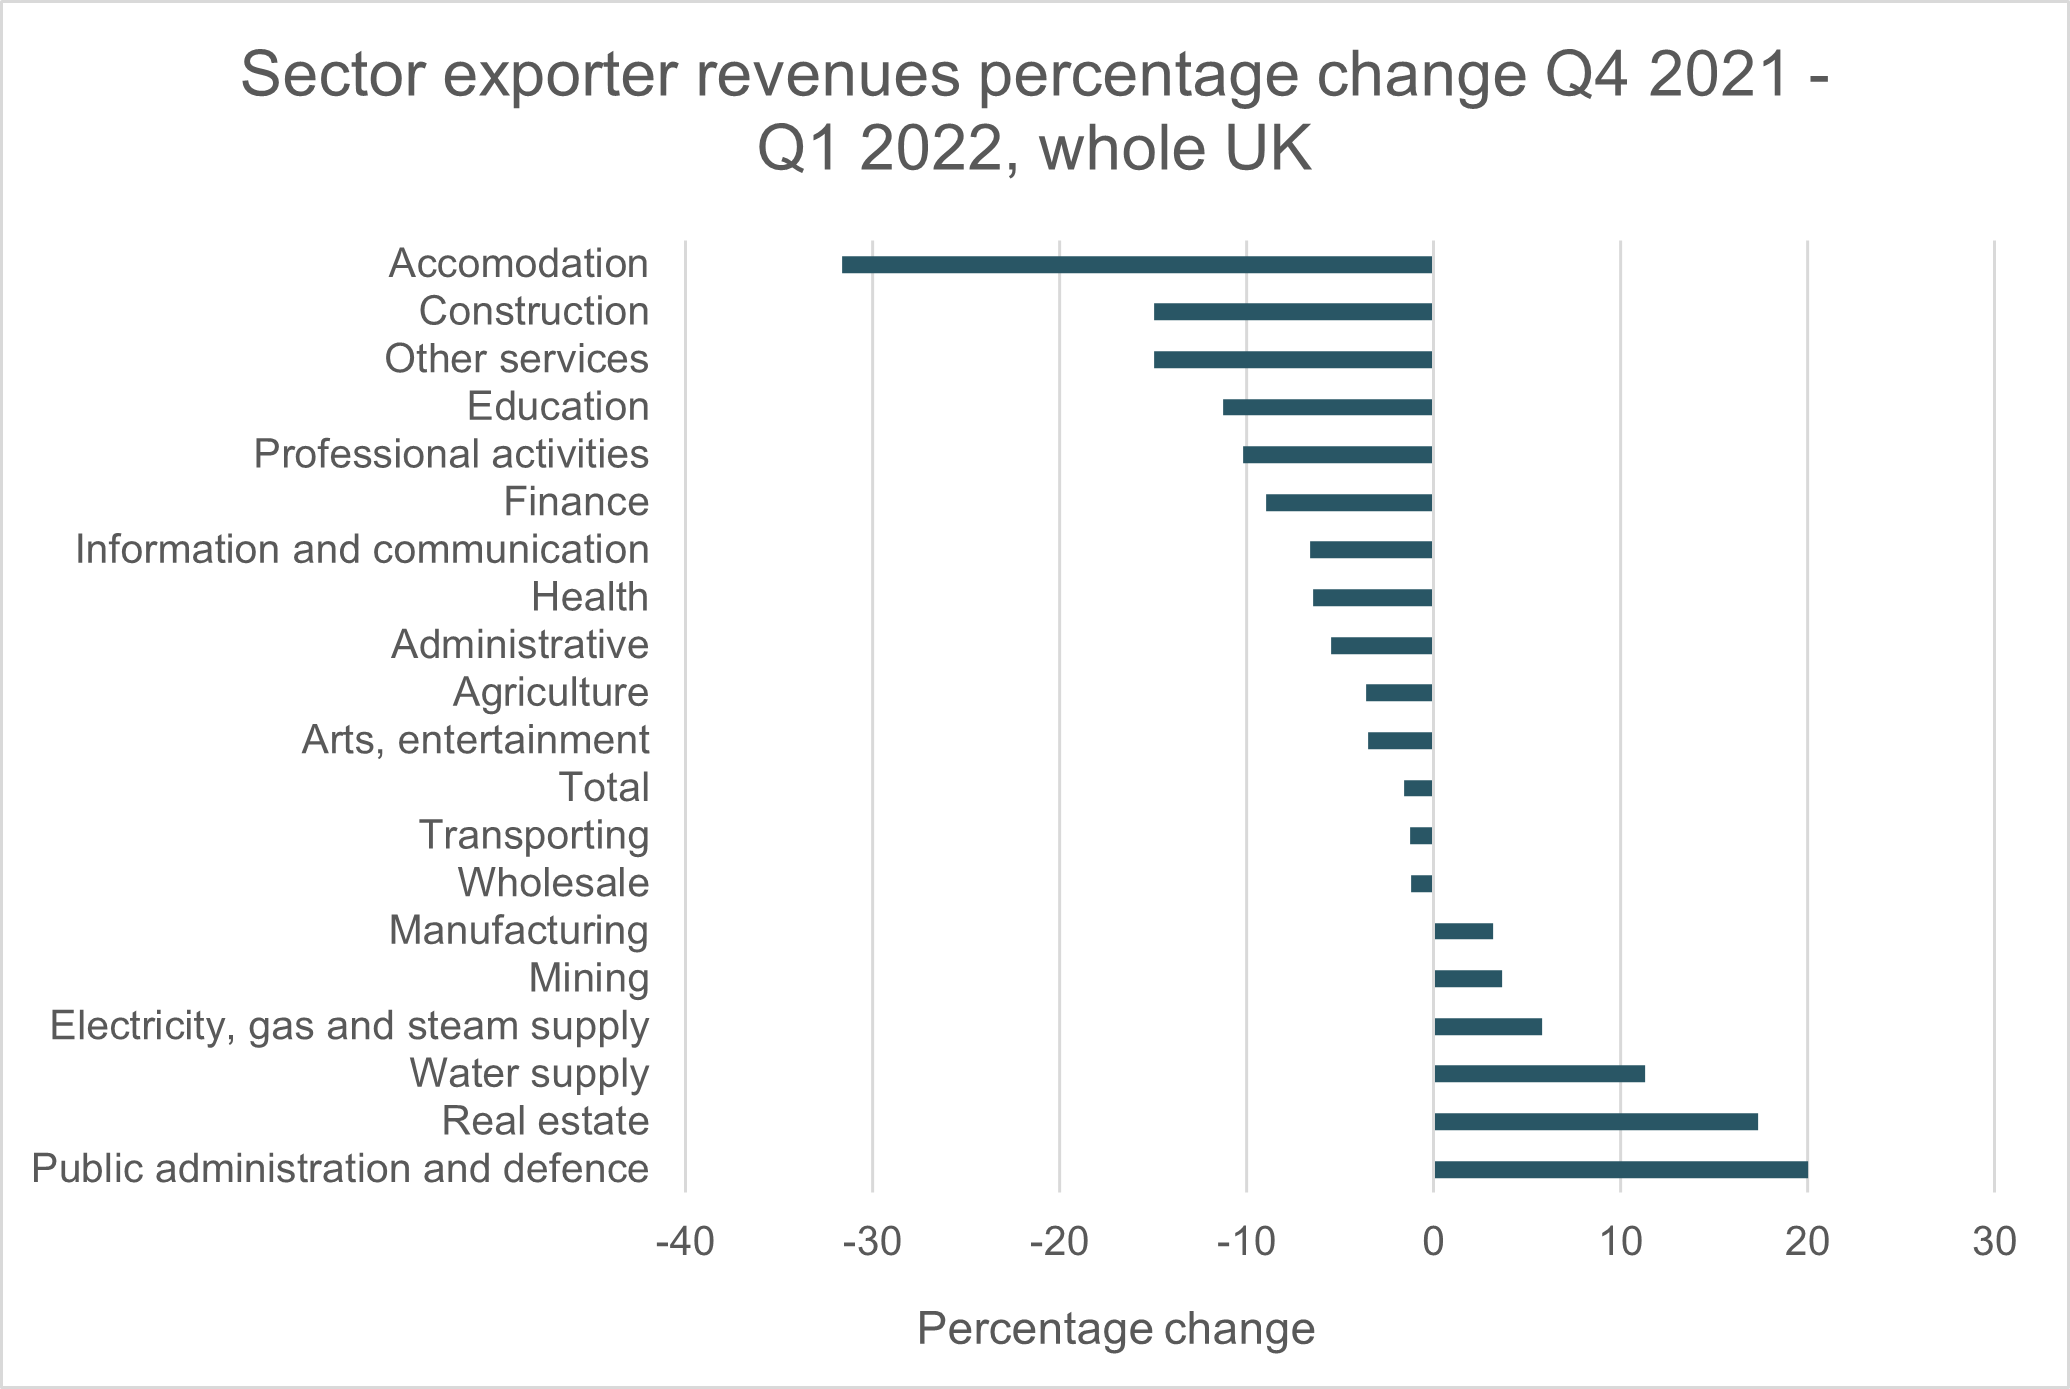
Figure 8: Quarter-on-quarter sector exporter revenues
Exporter revenues by sector
Revenues declined overall in Q1, but less markedly than counts or employment – at a 1.59% decline. Public Administration and Defence saw the largest growth at 20.03%, followed by Real Estate at 17.32% and Water Supply at 11.32%. The most declining sectors
this quarter were Accommodation at -31.64%, Construction at -14.95% and Education at -11.23%.
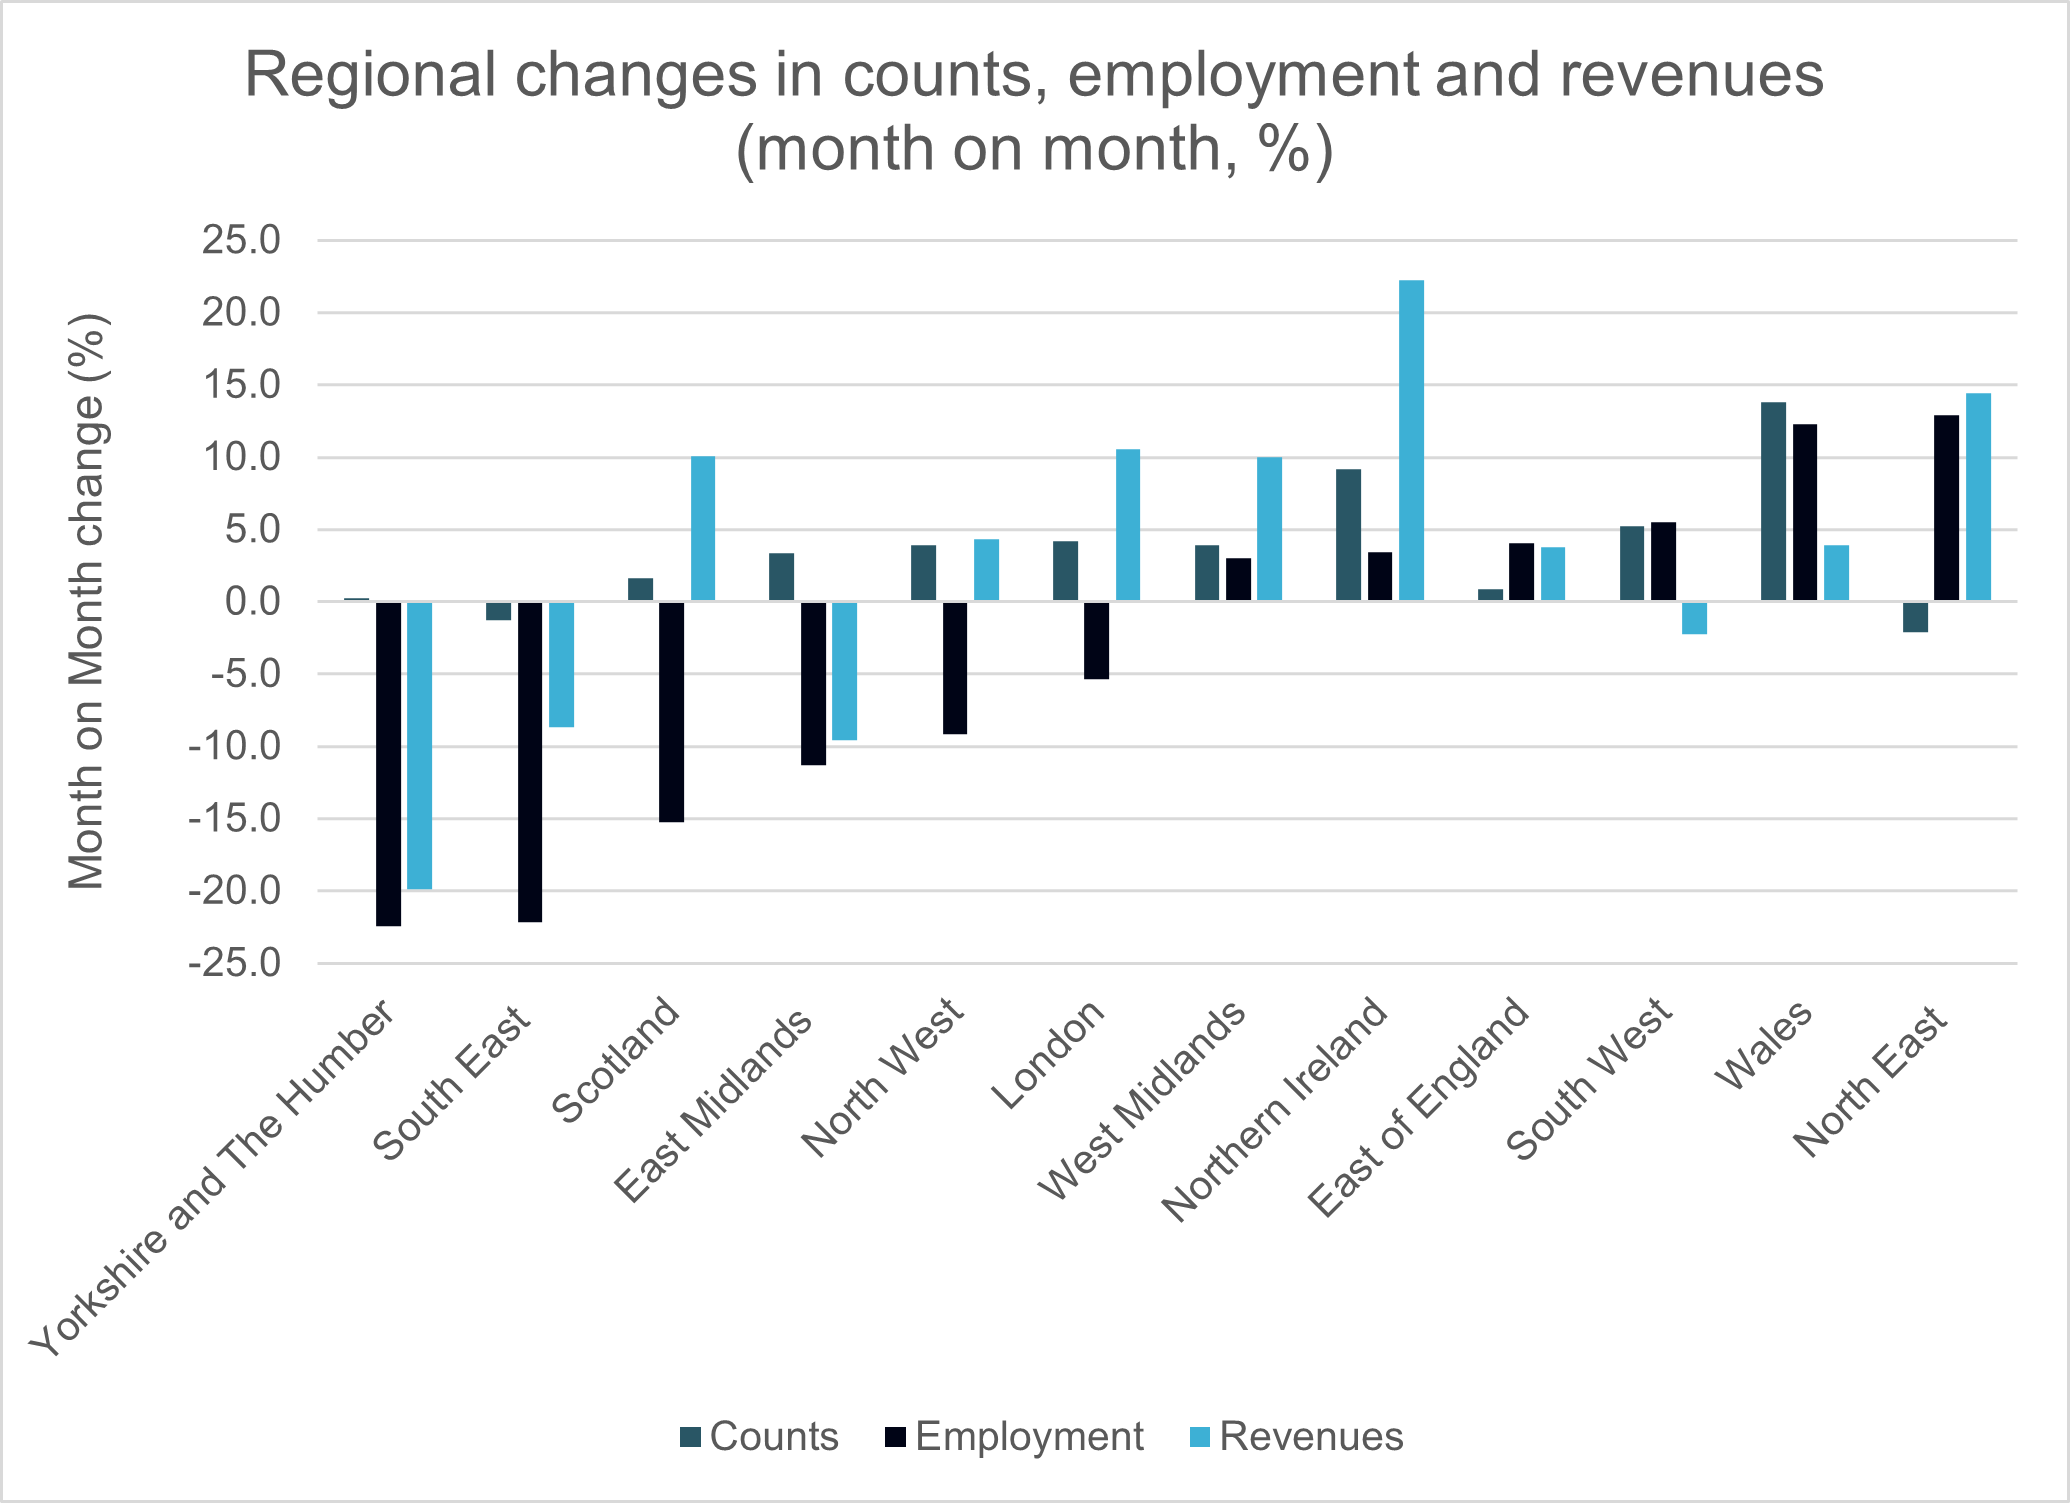
Figure 9: Regional changes in counts, employment and revenues
Month-on-month regional changes
At the month-on-month level, amongst the best performers was Northern Ireland with an increase of 9.2% in counts, 3.4% in employment, and 22.2% in revenues; the North East with -2.1% in counts, 12.9% growth in employment, and 14.4% growth in revenues; as well as Wales with a 13.8% growth in counts, a 12.3% growth in employment and a 3.9% growth in revenues.
As seen in the 12-month moving average changes, Yorkshire and The Humber did not perform well this month, with a 0.2% growth in counts, a -22.4% contraction in employment, and a -19.9% decline in revenues.
The South East also performed badly at -1.3% in counts, -22.2% in employment, and -8.7% in revenues. The East Midlands is another region which underperformed, at 3.4% growth in counts, -11.3% in employment, and -9.6% in revenues.
As the graph shows, the performance of London and Scotland is more complex – as both showed growth in counts and revenues yet declines in employment.
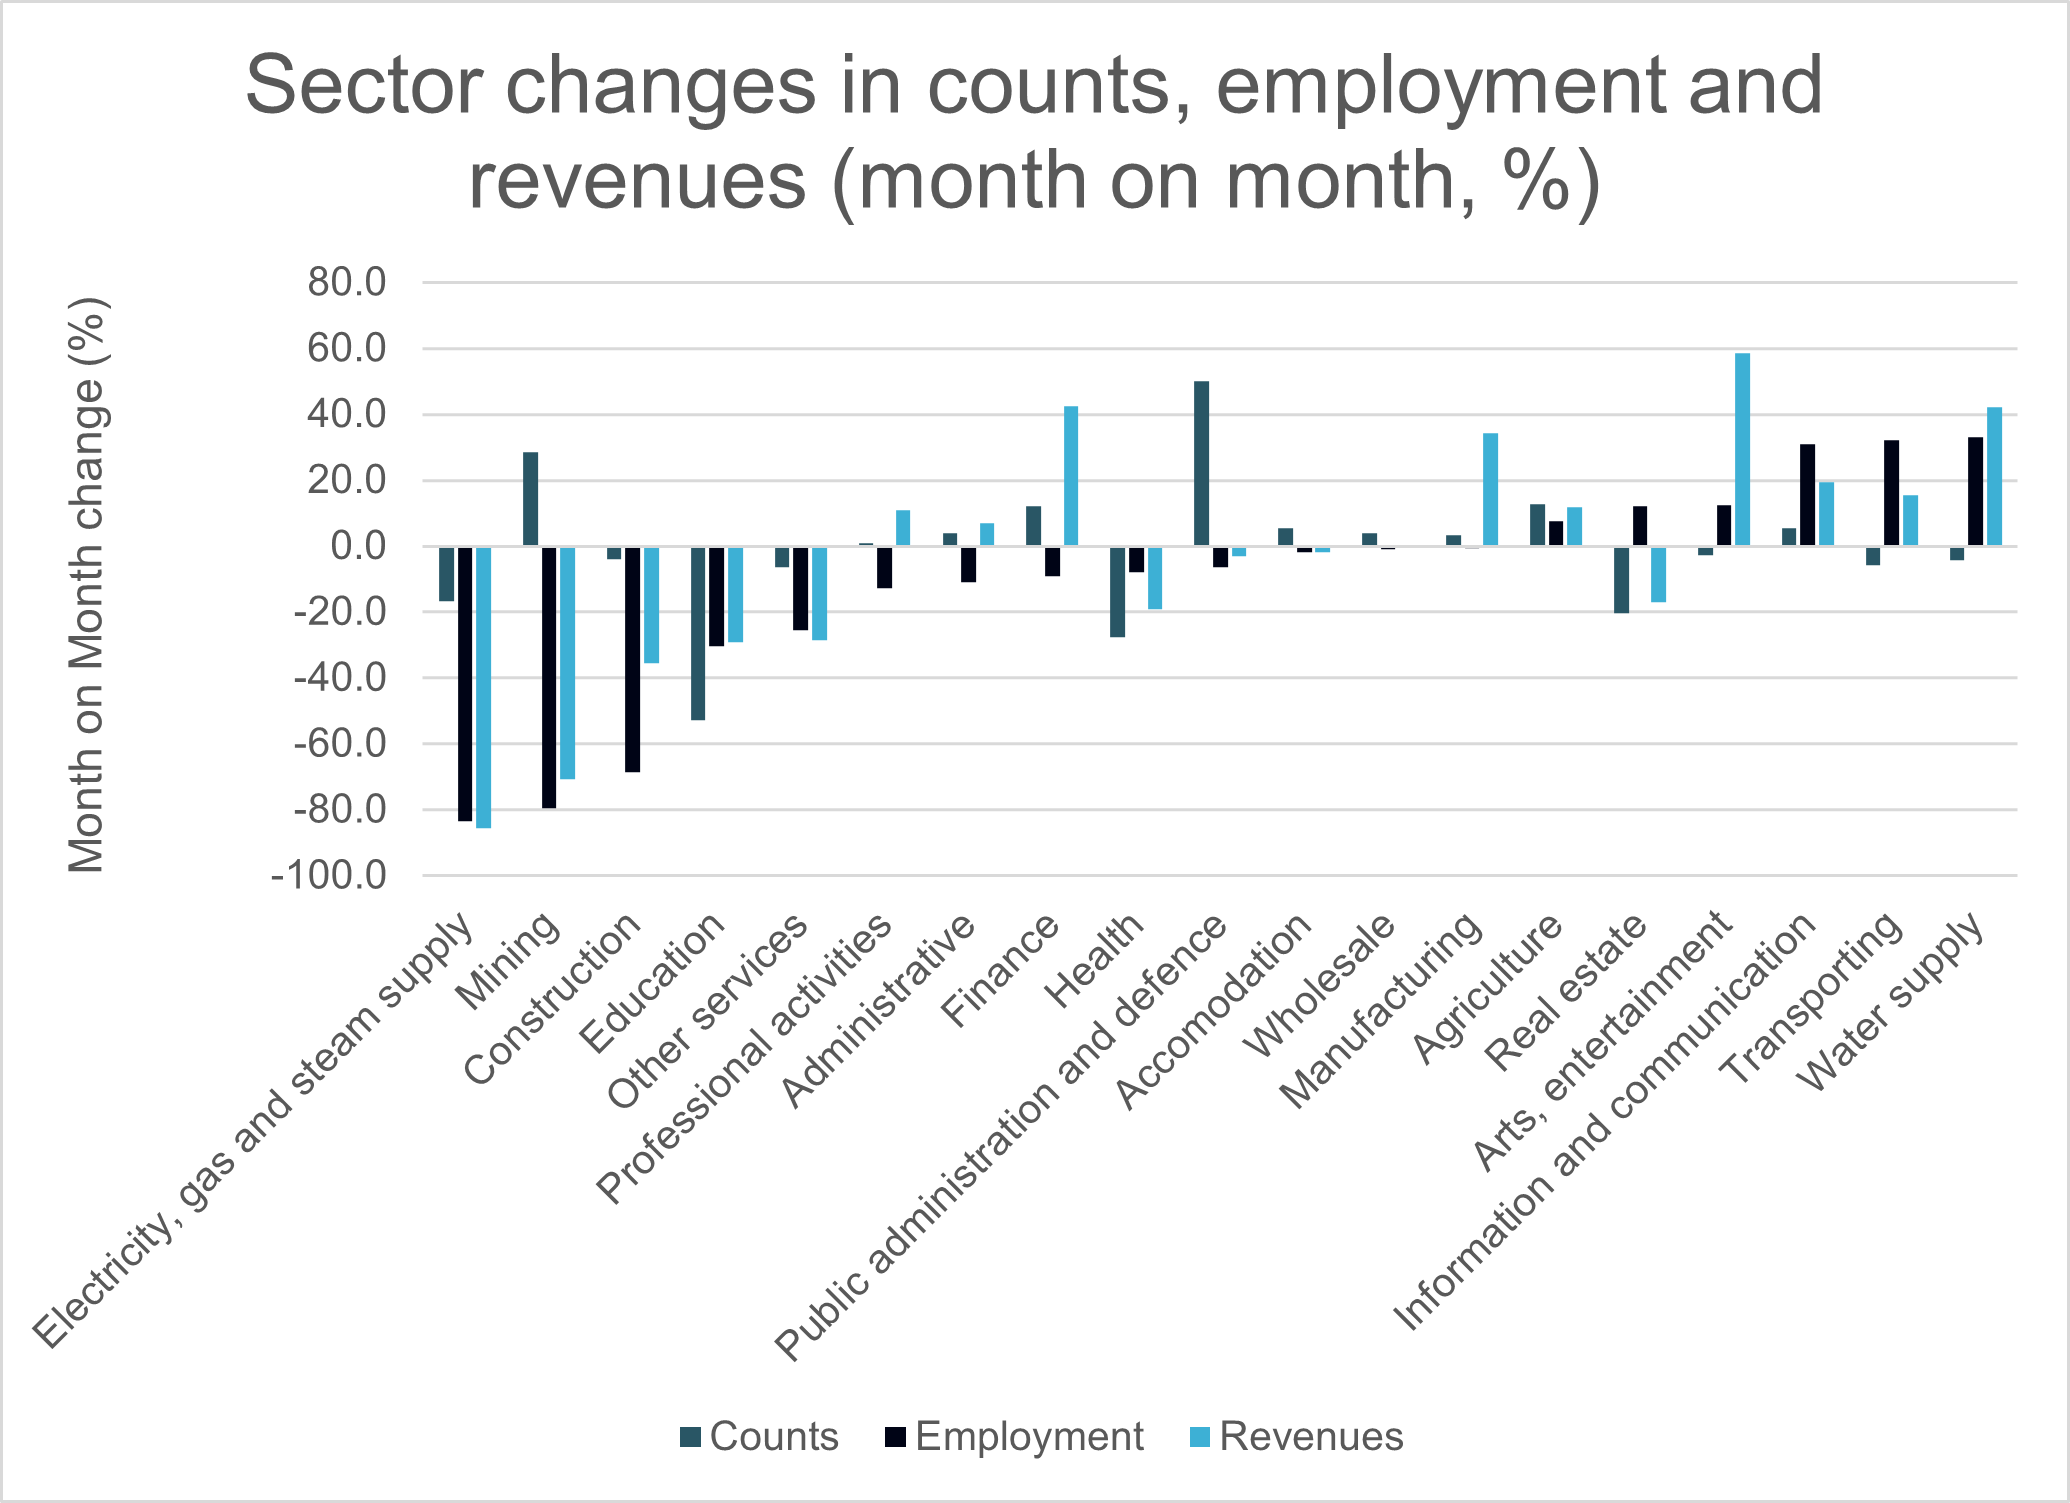
Figure 10: Sector changes in counts, employment, and revenues
Month-on-month sector changes
The month-on-month percentage change statistics at the sector level show high performance in areas such as Information and Communication at growth of 5.5% in counts, 30.9% in employment, and 19.4% in revenues, as well as Arts, Entertainment at -2.7% in counts, 12.5% growth in employment, and 58.4% growth in revenues.
Water Supply also did well, with -4.2% in counts, and a growth of 33% in employment, and 42.1% in revenues. Sectors that did not perform well include Electricity, Gas and Steam Supply, Mining, Construction and Education.
The performance of Finance presents a complicated picture, as it increased in counts and revenues at 12.1% and 42.4% respectively but saw a 9.3% contraction in employment.
Notes to editors
About Coriolis Technologies:
Founded in 2017, Coriolis Technologies is the leading source of trade, corporate, geopolitical risk and trade-related economic data globally for the trade finance sector. Coriolis Technologies provides clear intelligence and insight into trade flows, supply chains and disruptions for trade and trade finance.
About The Institute of Export & International Trade:
The Institute was established over 85 years ago to support UK businesses in growing their international markets and trade. The Institute is the leading association of exporters and importers providing education and training to professionalise the UK’s international traders.
Methodology
Coriolis Technologies has matched UK exporter data from Customs and Excise sources with Bill of Lading data and large-scale publicly available datasets. UK HMRC data covers the names and addresses of all UK exporters who send products through customs and excise. These names were matched to Bureau van Djik FAME data to establish turnover and employment levels.
To establish the numbers of service sector companies with export revenues, Coriolis took those businesses in the FAME database with international turnover to collect sector and employment as well as turnover information.
The sector distribution of exporters in goods and services was then applied to the sample of companies which did not have turnover or employment data to scale the whole dataset to establish counts, turnover and employment for the UK as a whole. Companies were taken from an HMRC sample going back to 2017 and any duplicates with international turnover data from FAME data removed.
The forecasts are based on a statistical “General Additive” modelling framework which decomposes each time series (each exporter count group) into a couple of main components:
- trend
- seasonality - effect of calendar month or season
- changepoints - moments where the trend shifts
- special calendar events
These effects are smoothed, added together and extrapolated into the future to create forecasted values for each exporter group separately. The model is optimized to explain as much variability in the time series with as simple model as possible.
The estimated forecasting error is within 1.7% of the actual value, back-tested on the actual forecasting performance over the past 2 years for the aggregate forecasts and for the forecasts by size and UK nation
For further information
Rebecca Harding, CEO, Coriolis Technologies
[email protected]
Tel : +44 - (0) 7803 710711
Twitter : @RebeccaAHarding
Data appendix
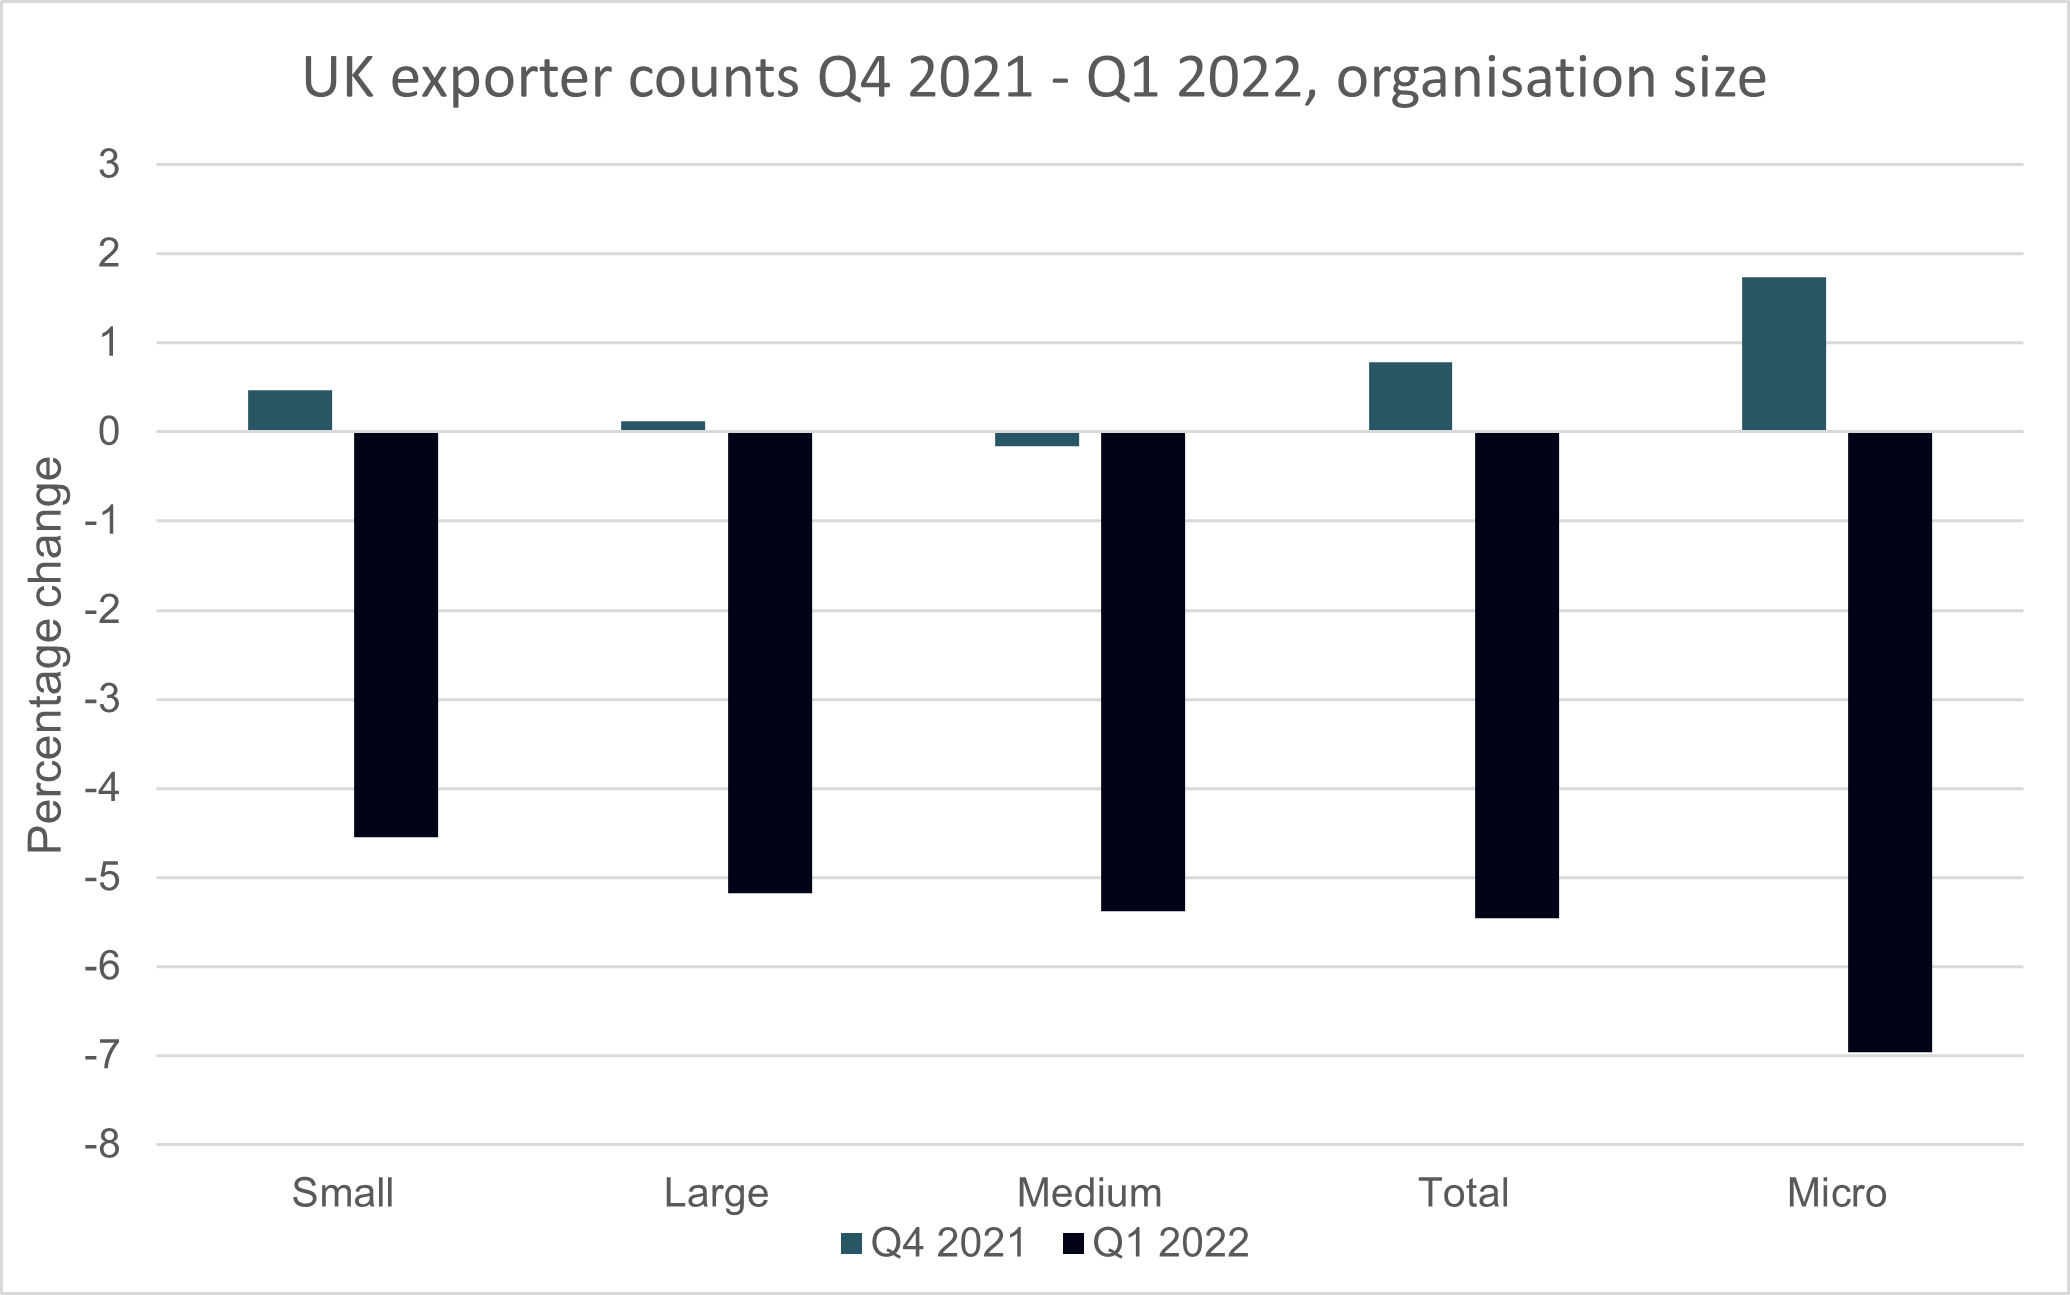
Figure A-1: UK quarterly exporter counts by organisation size
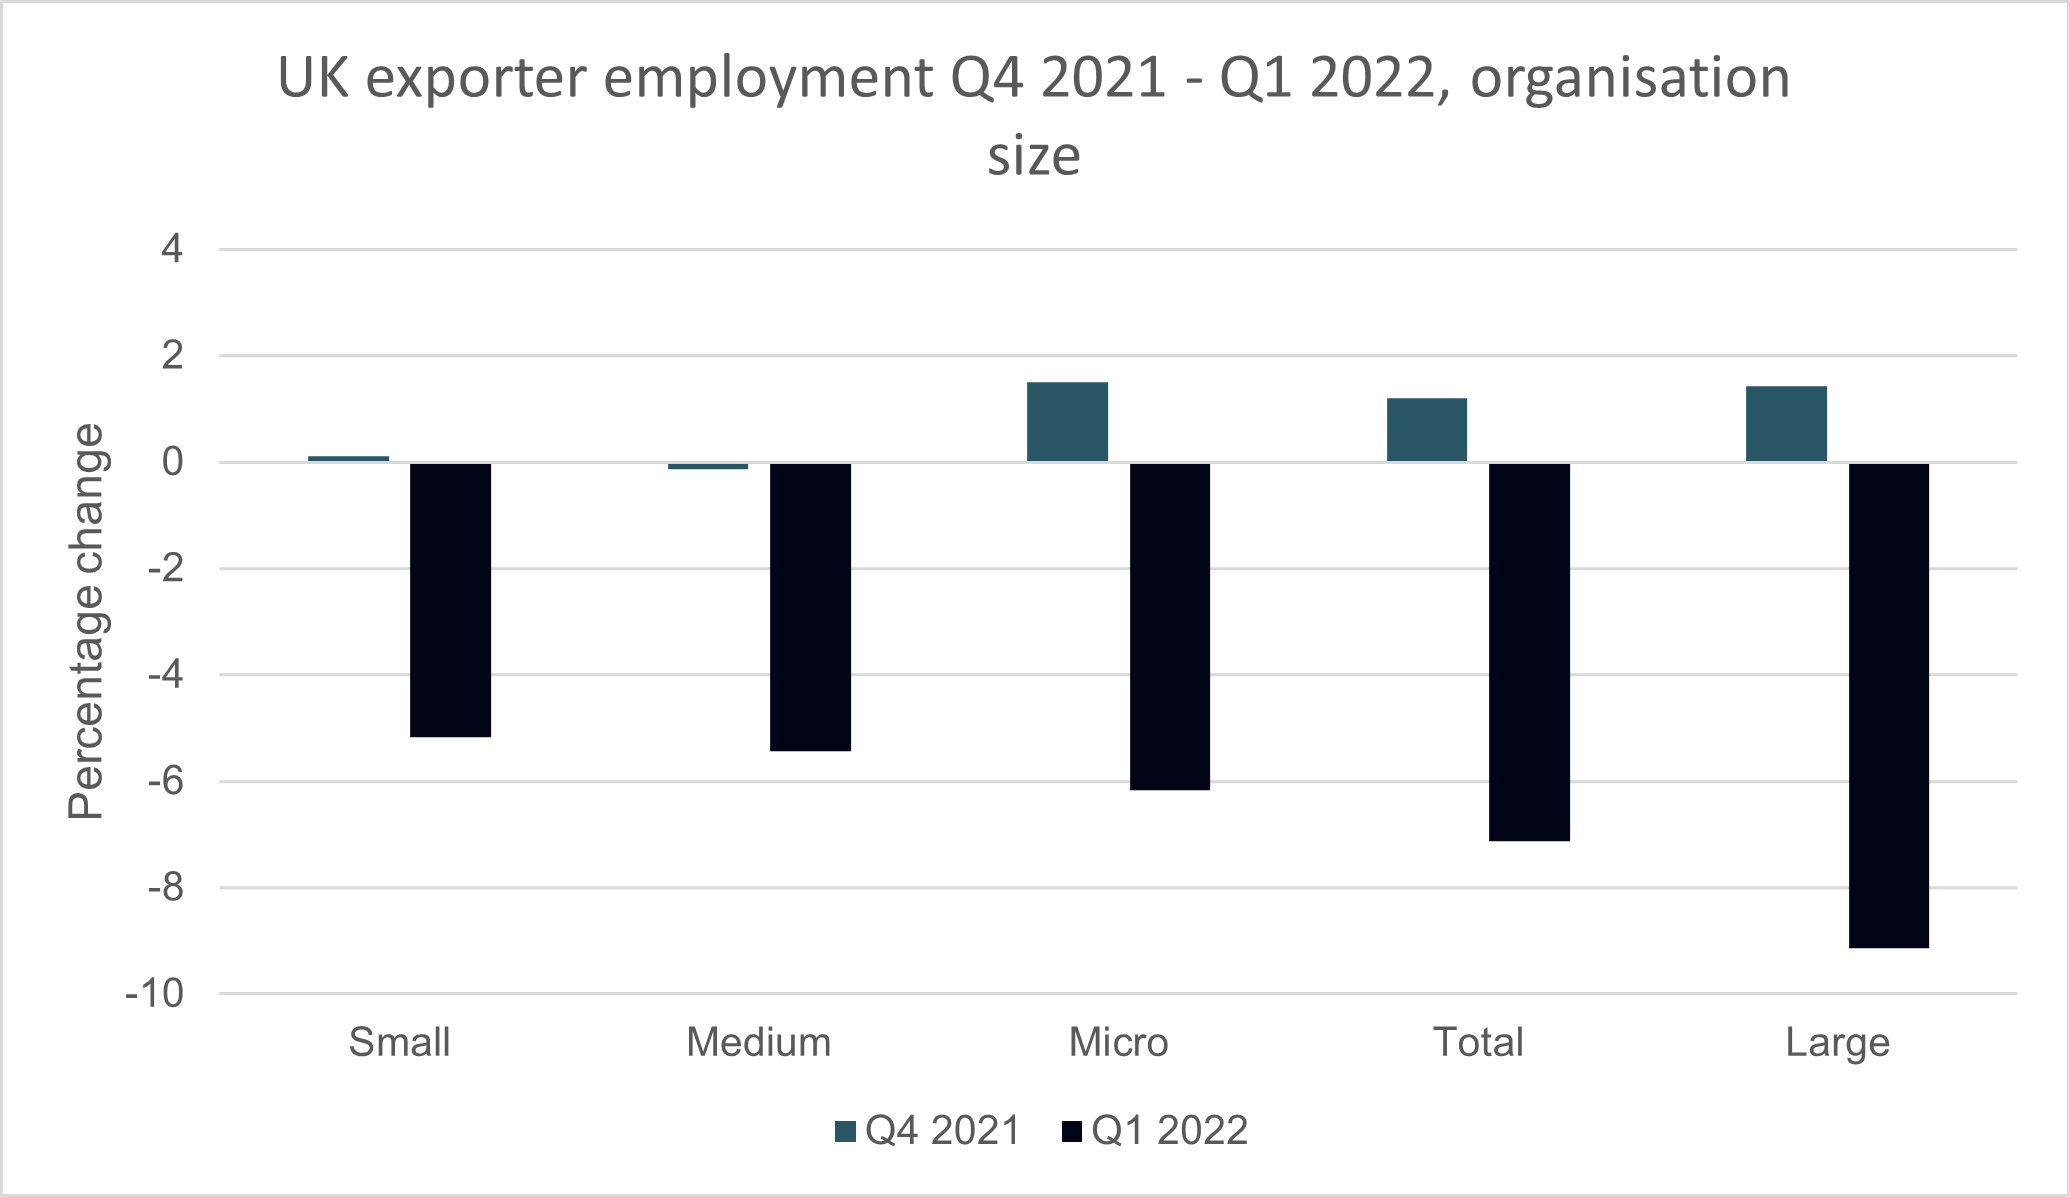
Figure A-2: UK quarterly exporter employment by organisation size
Figure A-3: UK quarterly exporter


